

Todas Atividades
Atualizada automaticamente
- Recentemente
-

This Bitcoin Zone Could Be Market’s Next True ‘Pivot,’ Says Glassnode
um tópico no fórum postou Redator Radar do Mercado
The on-chain analytics firm Glassnode has highlighted the $97,000 to $98,000 zone as an important one for Bitcoin. Here’s why. Bitcoin CBD Suggests Build Up Of Supply In This Range In a new post on X, Glassnode has discussed about a potentially significant zone for Bitcoin based on the Cost Basis Distribution. The Cost Basis Distribution (CBD) is an indicator that measures the amount of the BTC supply that investors last purchased or transferred at the various price levels. As is visible in the above graph, there is a dense supply zone located between $97,000 to $98,000. Generally, investors are quite sensitive to retests of their cost basis, so a large amount of them (or alternatively, a few large holders) having their acquisition level inside a narrow range could make retests of it significant for Bitcoin. When the mood in the market is bullish, holders can react to retests of their cost basis from above by buying more. They may do so believing that the same level would end up proving profitable again in the future and the retrace is just a ‘dip.’ The cryptocurrency suffered a plunge yesterday and nearly touched this region. Since then, however, things have turned around for the asset and it has gained some distance over it once more. In the event that the decline does continue, which may not be too unexpected given the volatile geopolitical situation at the moment, the zone could end up acting as the next true pivot for Bitcoin, according to the analytics firm. While the CBD tells us where the cryptocurrency’s supply is concentrated, it doesn’t contain any information about who bought or sold at those price levels. Glassnode’s behavioral cohorts, investor groups divided on the basis of their behavior, solve this problem. Here is a chart that shows the trend in the Bitcoin supply held by these holder cohorts over the past few years: There are five of these behavior groups. First Buyers (green) include the investors who are buying Bitcoin for the very first time. As displayed in the chart, the supply of this group has been on the rise, indicating fresh demand has been coming in. Momentum Buyers (blue) are those that capitalize on market momentum by buying during uptrends. On the opposite spectrum are the Conviction Buyers (purple), who buy despite falling prices. Finally, there are the Loss Sellers (red) and Profit Takers (yellow), who correspond to investors exiting at a loss and profit, respectively. During the past couple of weeks, the former cohort has seen an increase of 29%, a sign that weak hands have been capitulating. That said, the analytics firm has noted, “Conviction Buyers also increased, suggesting sentiment isn’t collapsing. Some are cutting losses – others are actively lowering their cost basis.” BTC Price At the time of writing, Bitcoin is floating around $103,900, down more than 4% in the last seven days. - Hoje
-
BNB Price Gathers Strength — Upside Potential Looms
um tópico no fórum postou Redator Radar do Mercado
BNB price is gaining pace above the $632 support zone. The price is now showing positive signs and might aim for more gains in the near term. BNB price is attempting to recover from the $600 support zone. The price is now trading below $632 and the 100-hourly simple moving average. There was a break above a bearish trend line with resistance at $625 on the hourly chart of the BNB/USD pair (data source from Binance). The pair must stay above the $632 level to start another increase in the near term. BNB Price Eyes More Gains After forming a base above the $600 level, BNB price started a fresh increase. There was a move above the $620 and $625 resistance levels, like Ethereum and Bitcoin. There was a decent move above the 50% Fib retracement level of the recent decline from the $651 swing high to the $602 low. Besides, there was a break above a bearish trend line with resistance at $625 on the hourly chart of the BNB/USD pair. The price is now trading below $632 and the 100-hourly simple moving average. It is also consolidating near the 76.4% Fib retracement level of the recent decline from the $651 swing high to the $602 low. On the upside, the price could face resistance near the $644 level. The next resistance sits near the $650 level. A clear move above the $650 zone could send the price higher. In the stated case, BNB price could test $665. A close above the $665 resistance might set the pace for a larger move toward the $680 resistance. Any more gains might call for a test of the $700 level in the near term. Another Decline? If BNB fails to clear the $644 resistance, it could start another decline. Initial support on the downside is near the $635 level. The next major support is near the $632 level. The main support sits at $625. If there is a downside break below the $625 support, the price could drop toward the $612 support. Any more losses could initiate a larger decline toward the $600 level. Technical Indicators Hourly MACD – The MACD for BNB/USD is gaining pace in the bullish zone. Hourly RSI (Relative Strength Index) – The RSI for BNB/USD is currently above the 50 level. Major Support Levels – $632 and $625. Major Resistance Levels – $644 and $650. -
Cardano Headed For $0.32 If This Level Isn’t Reclaimed – Is ADA’s Rally Over?
um tópico no fórum postou Redator Radar do Mercado
Cardano (ADA) has been struggling to hold some crucial levels over the month, falling to multi-month lows over the weekend. As the cryptocurrency attempts to hold a key support area, some analysts believe this make-or-break retest will determine its next big move. Cardano To See More Bleeding Cardano is recording a 4.5% daily increase after bouncing from the $0.51 area on Sunday. Notably, ADA was in a downtrend following its 3-year high of $1.32 in December 2024, which ended after the late April breakout and May bullish rally. However, the cryptocurrency has struggled to hold its April-May range amid the June market pullback, losing the key $0.66 area ten days ago. Since then, Cardano has recorded seven consecutive red daily candles and fallen below the $0.60 support. Sjuul from AltCryptoGems suggested that Cardano’s rally will be halted unless some ground is recovered. According to the analyst, the cryptocurrency’s multi-month price action “ended up being a classic distribution schematic” after losing the $0.66 support. This would signal that ADA’s uptrend has ended and a potential downtrend is ahead. “As long as we don’t reclaim $0.66, just expect further downtrend from now on,” he asserted. Meanwhile, market watcher Man of Bitcoin highlighted the cryptocurrency’s June downtrend, affirming that if the price remains below the descending trendline, downward pressure will persist. He added that “One more low in wave iv is still possible,” hinting that a drop below the $0.50 could be on the horizon before the next wave up. Nonetheless, the analyst noted that “it should be a brief wick to the downside” as a “sustained break lower would weaken the bullish outlook.” ADA Retest To Trigger Rally To $1? Amid the ongoing global war tensions, ADA’s price retested the crucial $0.52 support on Sunday, hitting a four-month low of $0.51, before recovering and closing the week around the $0.54 mark. Market watcher Rose Premium Signals noted that a weekly close around the crucial $0.56 level would continue the possible double-bottom setup forming on ADA’s chart. The analyst added that a confirmed rebound from the $0.54-$0-56 area could send the price to the initial $0.99 target and set the stage for a climb toward the $1.20 and $1.50 resistances. On the contrary, failing to hold this area could see Cardano lose its six-month price range and retrace to the $0.32 level. Meanwhile, Crypto Billion affirmed that Cardano appears to be forming a potential triple bottom structure, which could lead to a bullish reversal. As the cryptocurrency retested the $0.50-$0.52 area over the weekend, the analyst highlighted that this key range had been held twice before since the November breakout. Additionally, he pointed out that ADA’s price appears to be trading within a multi-month falling wedge pattern, which suggests a breakout toward the $1 mark if the price climbs toward the upper boundary. As of this writing, Cardano is trading at $0.54, a 15.6% decline in the weekly timeframe. -
XRP Price Reclaims Key Resistance — Are More Gains on the Horizon?
um tópico no fórum postou Redator Radar do Mercado
XRP price started a fresh increase from the $1.920 zone. The price is back above $2.10 and might struggle to continue higher above the $2.20 zone. XRP price started a fresh increase above the $2.050 zone. The price is now trading above $2.10 and the 100-hourly Simple Moving Average. There was a break above a key bearish trend line with resistance at $2.00 on the hourly chart of the XRP/USD pair (data source from Kraken). The pair might start a fresh increase if there is a close above the $2.180 resistance zone. XRP Price Eyes More Gains XRP price remained supported above the $1.920 zone and started a fresh increase, like Bitcoin and Ethereum. The price recovered above the $2.00 and $2.020 resistance levels. Besides, there was a break above a key bearish trend line with resistance at $2.00 on the hourly chart of the XRP/USD pair. The pair even cleared the $2.10 resistance and $2.150 hurdle. However, the bears were active below $2.20. A high was formed at $2.170 and the price is now consolidating above the 23.6% Fib retracement level of the upward move from the $1.910 swing low to the $2.170 high. The price is now trading above $2.10 and the 100-hourly Simple Moving Average. On the upside, the price might face resistance near the $2.1650 level. The first major resistance is near the $2.180 level. The next resistance is $2.20. A clear move above the $2.20 resistance might send the price toward the $2.250 resistance. Any more gains might send the price toward the $2.300 resistance or even $2.320 in the near term. The next major hurdle for the bulls might be $2.50. Another Drop? If XRP fails to clear the $2.180 resistance zone, it could start another decline. Initial support on the downside is near the $2.0880 level. The next major support is near the $2.050 level or the 50% Fib retracement level of the upward move from the $1.910 swing low to the $2.170 high. If there is a downside break and a close below the $2.050 level, the price might continue to decline toward the $2.00 support. The next major support sits near the $1.920 zone. Technical Indicators Hourly MACD – The MACD for XRP/USD is now losing pace in the bullish zone. Hourly RSI (Relative Strength Index) – The RSI for XRP/USD is now above the 50 level. Major Support Levels – $2.050 and $2.00. Major Resistance Levels – $2.180 and $2.20. -
Bitcoin’s Drop Below $100k Sparks Bearish Chatter, But Data Says Something Else
um tópico no fórum postou Redator Radar do Mercado
Bitcoin has rebounded slightly after dropping below the $100,000 mark, a decline attributed to escalating geopolitical tensions. The digital asset reached lows of approximately $98,974 following reports of US military strikes on Iran. At the time of writing, Bitcoin has regained some ground and is trading at $102,1010, representing a 2.4% increase over the past 24 hours and a 5.82% decrease over the last week. Amid this price performance, recent on-chain analysis points to a phase of consolidation rather than a structural breakdown. CryptoQuant analyst Darkfost shared in a QuickTake post that long-term Bitcoin holders appear to be maintaining their positions rather than exiting, indicating continued conviction despite short-term volatility. Bitcoin On-Chain Indicators Signal Consolidation, Not Capitulation According to Darkfost, the current market behavior is reflective of a quiet consolidation period, with long-term holders showing little inclination to sell. Based on the 30-day moving average of Binary Coin Days Destroyed (CDD), his analysis shows that the metric has stayed below the 0.8 threshold typically associated with major corrections. The value recently peaked at 0.6 before trending downward, suggesting limited market overheating at present levels. Darkfost emphasized that this moderation could precede a continuation of the broader bull cycle, mirroring past market structures where consolidation phases led to further price advances. He noted that past bull runs have often been characterized by a “staircase” trajectory, periods of sideways or modest downward movement followed by renewed upward momentum. In this context, subdued sentiment may indicate that the market is preparing for a potential next leg higher. The analyst wrote: Importantly, this does not signal the end of the bull cycle. Instead, similar to the past two phases, we may once again see a staircase-like movement where consolidation is followed by another leg up. Historically, Bitcoin’s explosive rallies tend to occur when market attention fades and sentiment is quiet, making the current silence potentially a precursor to the next big move. Whale Behavior Remains Steady Amid Market Tensions Complementing this outlook, another CryptoQuant contributor, Mignolet, provided insight into whale activity during the current consolidation phase. He noted that while the market setup resembles the double-top formation seen in 2021, key on-chain signals from whales have not aligned with those seen during that previous peak. Specifically, Ethereum transaction outflows, often used as a proxy for large investor exits, have not shown the kind of spikes observed during the 2021 market top. Mignolet pointed out that although Ethereum has seen a gradual decline in market share relative to other layer-1 and layer-2 chains since 2020, its transactional data still maintains a strong correlation with Bitcoin price movements. The absence of aggressive exit activity among large holders suggests that major market participants are not rushing for the exits, despite heightened geopolitical uncertainty and short-term price volatility. Featured image created with DALL-E, Chart from TradingView -
Ethereum Price Rebounds Strongly, Clears $2,350 Resistance With 8% Gain
um tópico no fórum postou Redator Radar do Mercado
Ethereum price started a fresh increase from the $2,120 zone. ETH is now up over 8% and might face resistance near the $2,460 zone. Ethereum started a fresh upward move above the $2,200 level. The price is trading above $2,250 and the 100-hourly Simple Moving Average. There was a break above a key bearish trend line with resistance at $2,240 on the hourly chart of ETH/USD (data feed via Kraken). The pair could start a fresh increase if it settles above the $2,460 resistance zone in the near term. Ethereum Price Regains Traction Ethereum price started a fresh increase from the $2,120 support level, like Bitcoin. ETH price was able to clear the $2,200 and $2,250 resistance levels to move into a positive zone. Besides, there was a break above a key bearish trend line with resistance at $2,240 on the hourly chart of ETH/USD. The bulls even pushed the price above the 61.8% Fib retracement level of the downward move from the $2,568 swing high to the $2,114 low. Ethereum price is now trading above $2,300 and the 100-hourly Simple Moving Average. On the upside, the price could face resistance near the $2,440 level. The next key resistance is near the $2,460 level. It is close to the 76.4% Fib retracement level of the downward move from the $2,568 swing high to the $2,114 low. The first major resistance is near the $2,500 level. A clear move above the $2,500 resistance might send the price toward the $2,550 resistance. An upside break above the $2,550 resistance might call for more gains in the coming sessions. In the stated case, Ether could rise toward the $2,620 resistance zone or even $2,650 in the near term. Another Decline In ETH? If Ethereum fails to clear the $2,460 resistance, it could start a fresh decline. Initial support on the downside is near the $2,340 level. The first major support sits near the $2,320 zone. A clear move below the $2,320 support might push the price toward the $2,250 support. Any more losses might send the price toward the $2,150 support level in the near term. The next key support sits at $2,120. Technical Indicators Hourly MACD – The MACD for ETH/USD is losing momentum in the bullish zone. Hourly RSI – The RSI for ETH/USD is now above the 50 zone. Major Support Level – $2,320 Major Resistance Level – $2,460 -
Bitcoin Paces $15 Billion YTD Influx Amid 10-Week Fund Flow Streak
um tópico no fórum postou Redator Radar do Mercado
Bitcoin and other crypto funds have kept the cash register flowing for 10 straight weeks, pulling in $1.24 billion in the latest period. That brings the year-to-date haul to $15 billion. Even holiday trading lulls and global jitters haven’t stalled the momentum. Investors seem to be treating this pullback as a chance to buy, not a reason to sell. Bitcoin And Ethereum Lead The Pack According to CoinShares data, Bitcoin pulled in $1.114 billion this week alone. It has now logged $2.37 billion month-to-date and $12.7 billion YTD, across nearly $152 billion in assets under management. Ethereum chipped in with its ninth straight week of gains, adding $124 million in weekly inflows. That pushed its month-to-date total past $1 billion and its YTD figure to $2.43 billion, across $14.29 billion of assets. Investors aren’t scooping up bearish bets, either: short Bitcoin products saw just $1.4 million in outflows this week and $8.7 million since January. Altcoins See Mixed Results Solana attracted $2.80 million this week and nearly $3 million month-to-date, lifting its YTD flows to almost $86 million. XRP pulled in $2.70 million weekly and $10.55 million month-to-date, taking its year-long total to $268 million across $1.205 billion in managed assets. But funds that package multiple tokens bled $5.76 million this week and almost $17 million for the month—though they’re still up $58 million in 2025. Other altcoin vehicles are in rough shape, with $509 million of outflows since January. Regional Trends Highlight The US The United States led global flows with $1.25 billion in weekly inflows. That’s $3.37 billion month-to-date and $14.30 billion YTD, out of $135 billion under management. Canada added nearly $21 million this week and $42.8 million for June. Germany chipped in almost $11 million while Australia booked $16.6 million. Brazil bucked the trend with $9 million of outflows this week and $26.4 million in June, but it’s still about $34.8 million ahead for the year. Smaller Tokens Struggle For Attention Some newer names drew mixed reactions. Sui saw $8.5 million drain this week despite $3.3 million of gains so far in June. Litecoin eked out $0.21 million in weekly inflows and clos to $6 million YTD. Cardano and Chainlink grabbed $0.34 million and $0.6 million this week, respectively. But smaller “other” products pulled in only $2.75 million against heavy selling since January. Institutions are still finding reasons to back crypto even as global events and holiday thins slow trading. Total weekly flows hit $1.23 billion, taking June’s total to $3.38 billion and the year’s to $15 billion, across $176 billion in overall assets. Based on these trends, big spenders aren’t ready to abandon digital tokens. They’re treating pullbacks like offers they can’t pass up. Featured image from Unsplash, chart from TradingView -
Bitcoin Price Turns Higher — Relief Rally Follows Reduction In Global Risk
um tópico no fórum postou Redator Radar do Mercado
Bitcoin price started a fresh increase from the $98,250 zone. BTC is now consolidating and might aim for a move above the $106,500 resistance. Bitcoin started a fresh increase above the $102,000 zone. The price is trading above $102,500 and the 100 hourly Simple moving average. There was a break above a key bearish trend line with resistance at $101,500 on the hourly chart of the BTC/USD pair (data feed from Kraken). The pair could start a fresh increase if it stays above the $102,500 zone. Bitcoin Price Recovers Ground Bitcoin price started a fresh increase from the $98,500 zone. BTC gained pace after Trump announced a ceasefire. The price was able to climb above the $102,000 and $103,200 levels. Besides, there was a break above a key bearish trend line with resistance at $101,500 on the hourly chart of the BTC/USD pair. The pair cleared the 61.8% Fib retracement level of the downward move from the $106,470 swing high to the $98,277 low. Finally, the price traded close to the $106,000 level. Bitcoin is now trading above $104,000 and the 100 hourly Simple moving average. It is also above the 76.4% Fib retracement level of the downward move from the $106,470 swing high to the $98,277 low. On the upside, immediate resistance is near the $106,000 level. The first key resistance is near the $106,200 level. The next key resistance could be $106,500. A close above the $106,500 resistance might send the price further higher. In the stated case, the price could rise and test the $108,000 resistance level. Any more gains might send the price toward the $110,000 level. Another Drop In BTC? If Bitcoin fails to rise above the $106,000 resistance zone, it could start another decline. Immediate support is near the $104,000 level. The first major support is near the $103,500 level. The next support is now near the $102,500 zone. Any more losses might send the price toward the $101,200 support in the near term. The main support sits at $100,000, below which BTC might struggle to find bids. Technical indicators: Hourly MACD – The MACD is now losing pace in the bullish zone. Hourly RSI (Relative Strength Index) – The RSI for BTC/USD is now above the 50 level. Major Support Levels – $104,000, followed by $103,500. Major Resistance Levels – $106,000 and $106,500. -
Bitcoin Binary CDD Hints At Healthy Consolidation, Not A Top
um tópico no fórum postou Redator Radar do Mercado
After a brief drop to $98,000 over the weekend, Bitcoin (BTC) has recovered and is now trading above $101,000 at the time of writing. While concerns about a potential double top persist, on-chain data has yet to show any major warning signs. Bitcoin Undergoing Healthy Consolidation According to a recent CryptoQuant Quicktake post by contributor Avocado_onchain, despite broader market sentiment turning bearish, BTC has not yet displayed any significant red flags. In fact, the cryptocurrency still appears to be in a consolidation phase. Notably, the 30-day moving average (MA) of Binary Coin Days Destroyed (CDD) indicates that long-term holders are continuing to hold onto their BTC rather than selling. This suggests that investors remain optimistic about Bitcoin’s potential for further upside in the near term. For the uninitiated, the 30-day MA Binary CDD smooths out daily fluctuations to show how frequently long-term Bitcoin holders are moving their coins over a month. A lower value suggests strong holding behavior and accumulation, while a higher value may indicate distribution or selling pressure from experienced holders. The analyst noted in a previous analysis that when Bitcoin’s Binary CDD exceeded 0.8, it was typically followed by a steep correction. However, this time, the indicator has peaked around 0.6 and is now on the decline – suggesting the market is far from overheating. They added: Although the data may not align perfectly from cycle to cycle, this moderation below 0.8 still implies the market may be entering a consolidation period, and further price or time correction could follow. The analyst emphasized that this indicator does not signal the end of the bull run. Rather – similar to the previous two market phases – Bitcoin could be following a “staircase-like movement,” where periods of consolidation are followed by a strong upward leg. They concluded that BTC historically tends to rally when market attention fades and sentiment remains quiet. Therefore, the current period of low volatility could be a precursor to Bitcoin’s next major move to the upside. Are BTC Bears In Trouble? While the current bearish sentiment may have raised hopes for further price pullback for the largest cryptocurrency by reported market cap, both technical and on-chain indicators suggest otherwise. For example, short positions have been rising sharply within the $100,000–$110,000 range, increasing the likelihood of a short squeeze – which could drive BTC to a new all-time high (ATH). That said, some caution is warranted, as short-term holders have been selling during recent dips, showing a lack of confidence in Bitcoin’s ability to sustain its upward trajectory. At press time, BTC trades at $101,954, up 1.1% in the past 24 hours. -
FTX Pushes Back on Three Arrows Capital’s $1.53 Billion Claim
um tópico no fórum postou Redator Radar do Mercado
The team winding down FTX’s bankruptcy is firing back at a massive claim filed by collapsed hedge fund Three Arrows Capital, better known as 3AC. The $1.53 billion claim, according to FTX’s legal filing, is not only exaggerated but also based on flawed assumptions and poor risk management by 3AC itself. In court documents, FTX argues that 3AC’s $1.5B claim ignores key facts about margin breaches and fund withdrawals. At the heart of the dispute is a series of leveraged trades placed by 3AC on the FTX platform before both companies went under. FTX says 3AC ignored margin calls, withdrew funds instead of posting collateral, and ultimately forced FTX to liquidate their positions. Now, 3AC’s liquidators want the court to believe that FTX owes them more than a billion dollars. What Really Happened With the 3AC Account Back in 2022, 3AC held a sizeable margin trading account on FTX. This was around the time the broader crypto market was reeling from the collapse of Terra and a general loss of confidence. 3AC had borrowed funds and placed large bets on the platform. When the market turned and the value of those positions dropped, FTX says it sent out alerts warning that the account had fallen below margin requirements. According to court filings, 3AC went silent for over six hours and instead pulled $18 million in Ethereum from the account. FTX then liquidated the positions, claiming the move was not only allowed under the terms of the agreement but necessary to avoid deeper losses. After the liquidation, the account still held $82 million, and FTX argues that letting the position ride longer would have led to a negative balance. DISCOVER: Next 1000X Crypto: 10+ Crypto Tokens That Can Hit 1000x in 2025 Why FTX Believes the Claim Is Inflated FTX’s legal team is asking the Delaware bankruptcy court to reject the full claim. They argue that 3AC is trying to rewrite history by blaming FTX for its own poor decisions. In their view, the hedge fund’s massive exposure, late response, and untimely withdrawal of funds created a hole in the account. FTX had no choice but to close it. To strengthen its case, FTX brought in a consultant from Alvarez & Marsal, who reconstructed the trading data and found that the liquidation was justified. A legal expert in British Virgin Islands law, where 3AC was incorporated, also weighed in. They said the legal theory behind 3AC’s claim did not hold up. BitcoinPriceMarket CapBTC$2.09T24h7d30d1yAll time The numbers also don’t quite add up. FTX says the crypto balance in 3AC’s account was around $1.02 billion, but after subtracting liabilities, withdrawals, and the value lost during the market crash, the final balance was much smaller. FTX argues that 3AC’s claim of being owed $1.53 billion simply does not reflect what happened. DISCOVER: 20+ Next Crypto to Explode in 2025 What Comes Next in the Case 3AC’s team has until July 11 to formally respond to the objection. =””>reserver-spaces=”true”>>A court hearing has been scheduled for August 12 in Delaware, where a judge will decide how much, if any, of 3AC’s $1.5B claim can move forwarda-preserver-spaces=”true”>. Source: Shutterstock FTX’s bankruptcy process still ties up billions, and many creditors await clarity. This case could influence how quickly and fairly remaining funds are distributed. It also raises questions about how claims between failed crypto firms should be handled when both sides made serious mistakes. 3AC’s $1.5B claim might reshape how collapsed crypto firms handle creditor disputes. DISCOVER: 20+ Next Crypto to Explode in 2025 Join The 99Bitcoins News Discord Here For The Latest Market Updates Key Takeaways FTX is challenging a $1.53 billion claim from Three Arrows Capital, calling it inflated and based on flawed assumptions. paces=”true”> FTX says 3AC failed to meet margin calls, withdrew $18 million in ETH, and forced FTX to liquidate its account to prevent deeper losses. paces=”true”> A consultant reconstructed trading data showing the l iquidation was justified, and a BVI legal expert disputed the basis of 3AC’s claim. paces=”true”> FTX argues the remaini ng account value did not support a claim of over $1 billion after accounting for liabilities and withdrawn assets. The court will hear the dispute on August 12, and 3AC must respond to FTX’s objection by July 11. The post FTX Pushes Back on Three Arrows Capital’s $1.53 Billion Claim appeared first on 99Bitcoins. -
Bitcoin STHs Capitulate: 14,700 BTC Moved To Exchanges At Loss
um tópico no fórum postou Redator Radar do Mercado
As volatility engulfs the cryptocurrency market amid war tensions, on-chain data shows that the Bitcoin short-term holders are selling at a loss. Bitcoin Short-Term Holders Just Made Large Exchange Inflows At A Loss In a new post on X, CryptoQuant author Axel Adler Jr has talked about how the Bitcoin short-term holders have reacted to the price volatility that has come alongside rising tensions in the Middle East following US strikes on three nuclear facilities in Iran. The short-term holders (STHs) refer to the BTC investors who purchased their coins within the past 155 days. The other side of the network, the holders with a holding time greater than 155 days, are termed as the long-term holders (LTHs). The former group contains the new entrants and low conviction holders, who generally panic easily whenever some change occurs in the market. On the other hand, the latter cohort includes the veterans of the market, who tend to sit tight through crashes and rallies alike. As such, given the recent sharp price action that has occurred in the sector, the STHs are likely to have made some moves. And indeed, on-chain data would confirm so. The above chart, shared by the analyst, shows the data for the profit and loss exchange deposit transactions that the STHs as a whole are making. Investors usually transfer to these centralized platforms when they want to sell, so inflows going to them can provide hints about whether selling is elevated or not. From the graph, it’s visible that the loss transactions going to the exchanges from this cohort have amounted to 14,700 BTC, which, although lower than the two major capitulation events from the past couple of months, is significant. Thus, it would appear that some of the STHs have reacted to the news by exiting the market, even if it means taking a loss. It’s also apparent from the chart that the profitable transfers have remained relatively low at 3,100 BTC. This is likely down to the fact that the STHs are left with little profit following the price decline, as the on-chain analytics firm Glassnode has pointed out in an X post. In the chart, the trend of the STH Realized Price is displayed. This indicator keeps track of the Bitcoin cost basis or acquisition level of the average STH. During the crash, the price almost retested the line, and even after the rebound, it remains close to it, meaning the profit margin for the cohort is still tight. BTC Price At the time of writing, Bitcoin is trading around $101,300, down over 5% in the last week. -
Fed Drops ‘Reputational Risk’ Standard, Easing Path for Crypto Banking
um tópico no fórum postou Redator Radar do Mercado
The Federal Reserve has officially joined the FDIC and the OCC in removing “reputational risk” from the list of factors used to assess whether banks can do business with certain industries. This quiet but significant update could change how banks engage with the crypto world. For years, crypto companies in the United States have faced a frustrating problem. Even when fully legal and compliant, many found themselves locked out of traditional banking. The issue wasn’t fraud or instability. It was image. Banks were worried that working with crypto firms would hurt their reputation. That kind of risk, often vague and hard to define, could trigger extra scrutiny during exams. It discouraged banks from touching anything remotely controversial. That barrier just got a lot lower. Why This Decision Matters Now The concept of reputational risk was never clearly defined. It gave regulators broad discretion to flag a bank for doing business with companies that were legal but unpopular in some circles. Crypto firms have long felt the pressure from this. Some have been dropped by their banks without explanation. Others never got access in the first place. The change from the Fed means that banks are no longer expected to consider how public perception might affect their business relationships. They are still required to assess financial, operational, and legal risk, but the question of what might look bad is no longer part of the equation. This doesn’t mean banks will rush to onboard crypto clients tomorrow, but it does clear up a gray area that has held things back. Now, banks can focus on what actually matters—whether a client is safe, compliant, and financially sound. DISCOVER: 9+ Best High-Risk, High-Reward Crypto to Buy in June 2025 A Break for Crypto’s Banking Problem For crypto firms, this update removes a major source of friction. Many companies have been stuck relying on foreign institutions or risky payment workarounds just to handle basic banking. Even large, well-established platforms struggled to maintain consistent relationships with U.S. banks. And smaller startups? They barely stood a chance. With the reputational hurdle gone, banks are in a better position to evaluate crypto clients based on real risk, not speculation or fear of bad press. That opens the door, at least in theory, for more stable and long-term partnerships. BitcoinPriceMarket CapBTC$2.09T24h7d30d1yAll time Of course, crypto still carries real risk. Banks will continue to monitor for fraud, compliance failures, and volatility. But those are standard parts of any risk assessment. What changes now is that the decision to work with a crypto firm is no longer shadowed by what regulators or the media might think about it. DISCOVER: Best New Cryptocurrencies to Invest in 2025 Setting the Tone Across Agencies The Fed’s move is part of a broader effort to bring consistency across U.S. financial oversight. Earlier this year, both the FDIC and the OCC made the same adjustment. With all three major regulators aligned, the message is clearer. Banks will not be punished for working with legal businesses simply because they are controversial. This creates a more predictable environment for both banks and the crypto industry. It also removes a layer of discretion that some viewed as inconsistent or even political. Going forward, if a firm meets legal and compliance requirements, it should be able to access essential financial services without facing invisible roadblocks. A More Practical Approach to Risk The decision to drop reputational risk does not mean regulators are taking their foot off the gas. It means they are narrowing their focus to real, measurable threats to safety and stability. That shift could help modernize oversight for industries that are rapidly evolving. Crypto is still far from fully integrated into the traditional financial system, but this is one less obstacle standing in the way. And for companies that have spent years fighting for basic banking access, that is a meaningful step forward. DISCOVER: 20+ Next Crypto to Explode in 2025 Join The 99Bitcoins News Discord Here For The Latest Market Updates Key Takeaways The Federal Reserve has removed reputational risk from its supervisory guidelines, aligning with the FDIC and OCC. Banks are no longer required to consider public image when deciding whether to work with crypto firms. This change makes it easier for legal and compliant crypto companies to access traditional banking services in the U.S. The move could lead to more stable partnerships between banks and crypto firms based on real risk, not fear of controversy. With all three major regulators aligned, the decision signals a more consistent and objective approach to financial oversight. The post Fed Drops ‘Reputational Risk’ Standard, Easing Path for Crypto Banking appeared first on 99Bitcoins. -
 🟡 Ouro em Máximas Históricas? Cuidado: Ainda Está Subvalorizado em Relação à Impressão de Dinheiro Por Igor Pereira | Analista de Mercado – ExpertFX School Mesmo com o ouro negociado a $3.349 por onça troy, renovando máximas históricas nominais, analistas experientes apontam que o metal precioso segue profundamente subvalorizado quando medido contra a verdadeira referência de valor: a base monetária global. Segundo Ronald Stoeferle, sócio da Incrementum AG e autor do respeitado relatório In Gold We Trust, o mercado está ignorando o efeito acumulado da impressão monetária desde 1980, especialmente após a crise financeira de 2008 e os pacotes trilionários da era COVID. 📉 Ouro subiu 294% — mas o dólar foi impresso em 3.500% Stoeferle expôs um dado que poucos consideram: Desde 1980, o preço do ouro subiu cerca de 294%; No mesmo intervalo, a base monetária dos EUA cresceu mais de 3.500%. Ou seja, apesar do ouro estar hoje em $3.349, seu valor real ajustado ao colapso do dólar ainda está defasado. 🟥 Trump e a nova fase da desvalorização do dólar Com Donald Trump prestes a retomar a presidência dos EUA, o mercado já precifica pressão política direta sobre o Federal Reserve, exigindo corte de juros e dólar mais fraco. 🟠 Ouro ainda está precificado como se fosse 2008 Apesar do preço nominal atual, o ouro continua a ser negociado como se ainda estivesse no ambiente monetário pré-QE, desconsiderando totalmente os riscos fiscais, a desconfiança internacional sobre os Treasuries e a aceleração global de compra de ouro físico por bancos centrais. 📊 Implicações para os mercados XAU/USD: Forte potencial estrutural de alta no médio e longo prazo. O atual nível de $3.349 ainda não reflete o real colapso do dólar. Dólar (DXY): Pressão para desvalorização com novo ciclo de cortes de juros e aumento do déficit fiscal sob Trump. Mercado de Treasuries: Perda de confiança global, levando a mais rotatividade para ouro físico. Fluxo institucional: ETFs como GLD e PHYS devem registrar novo crescimento no volume de entrada de capital institucional. Perspectiva técnica: A superação do nível de $3.300 ativa alvo em $3.500 no curto prazo e $4.000 no médio prazo, com suporte em $3.190. 📌 Conclusão: O preço do ouro já superou a barreira psicológica dos $3.300, mas ainda está descontado em relação à base monetária global e ao risco sistêmico crescente dos EUA. O valor real do ouro, quando ajustado ao colapso fiduciário, aponta para uma continuação do bull market secular. 🔎 Continue acompanhando o portal ExpertFX School para atualizações em tempo real sobre ouro (XAU/USD), política monetária, dólar, inflação e movimentos de bancos centrais. Igor Pereira Membro WallStreet NYSE | Analista-Chefe – ExpertFX School
 -
The BNB Paradox: Bearish Breakdown Meets Bullish Flag, Which Will Prevail?
um tópico no fórum postou Redator Radar do Mercado
BNB finds itself at a pivotal crossroads where conflicting signals collide — a bearish breakdown challenging key support levels, yet a bullish flag pattern hints at a potential upward surge. This paradox leaves traders and investors weighing which force will ultimately dominate the market’s next move. As pressure mounts from both sides, understanding the technical nuances behind this tug-of-war becomes crucial to anticipating BNB’s trajectory in the near term. BNB Faces Pressure From Key Technical Levels Analyzing the BNBUSD setup on the M30 timeframe, Thomas Anderson in an X post highlighted that the price is currently testing the yellow support line at $626.95, following a decisive drop below the cyan price line at $633.99. This breakdown has shifted short-term sentiment, suggesting that sellers are beginning to exert stronger control over the price action. According to Anderson, the 200 MA (red line), positioned between $642 and $645, is now acting as a dynamic resistance zone overhead. With price trading below this moving average, any attempts at recovery may face immediate rejection. He also pointed out that the H1 chart confirms the ongoing bearish momentum, with the price continuing to trade below both the cyan level and the 200 MA. This alignment between the M30 and H1 timeframes strengthens the case for further downside movement, especially if the current support at $626.95 fails to hold. Until buyers manage to reclaim key resistance levels, the overall outlook remains weak, and traders should keep an eye on how the price behaves around the current support to gauge the next likely move. BNB’s Price Outlook Strengthened By Bullish Continuation Signal Despite the bearish outlook presented by Thomas Anderson, eL Zippo expressed a more optimistic stance in his latest X tweet regarding BNB. He believes that BNB still has the potential to rise in value, challenging the prevailing negative sentiment around its recent price action. EL Zippo’s view is supported by the formation of a bullish flag pattern on the chart. This pattern is widely recognized as a continuation signal, indicating that the asset may resume its prior upward trend after a period of consolidation. For eL Zippo, the presence of this structure suggests that BNB could be setting up for another leg higher if market conditions align. At the time of writing, BNB was trading around the $623 mark, reflecting steady price action. The asset’s market capitalization stood at approximately $87.7 billion, signaling strong investor interest. Additionally, BNB recorded a 24-hour trading volume of roughly $1.8 billion, with price and volume showing percentage gains of 2.11% and 13.22%, respectively—an indication of renewed activity and positive sentiment in the market. - Yesterday
-
British Columbia launches new land use planning process with Tŝilhqot’in Nation
um tópico no fórum postou Redator Radar do Mercado
The Province of British Columbia has secured a mandate to enter into discussions with the Tŝilhqot’in Nation to define how Indigenous consent would be incorporated into the decision-making process for future mining projects in the Teẑtan Area of the province’s Interior. The mandate would enable the Ministry of Indigenous Relations and Reconciliation, the Ministry of Mining and Critical Minerals, and the Environmental Assessment Office, to enter negotiations with the Tŝilhqot’in Nation, should it agree to consider any reviewable mining project in the region, the BC government stated in a press release dated June 18. Any agreement would fall under the Declaration on the Rights of Indigenous Peoples Act (Declaration Act) and be negotiated if the Tŝilhqot’in Nation decided in the future to consider any mine in the Teẑtan Area. Currently, there are no specific mining proposals under review for the Teẑtan Area. Consent-based agreements The mandate builds on previous agreements that affirm the requirement of Tŝilhqot’in consent before any reviewable mining project can proceed in the area. If triggered, negotiations would be conducted under Section 7 of the Declaration Act, which allows for consent-based agreements as part of reconciliation efforts. The legislation also mandates engagement with other potentially affected groups, including local governments, First Nations and mineral rights holders. The Province of BC has identified a number of stakeholders to be consulted during any future negotiation process. These include: Cariboo Regional District, Mining Association of British Columbia, Association for Mineral Exploration, Overlapping mineral tenure holders, and the Business Council of British Columbia. Additional interest holders may be added if a specific mining project is brought forward and the Declaration Act Agreement is initiated, it said. AME response The Teẑtan Area has been the focus of longstanding stewardship and governance by the Tŝilhqot’in Nation, and the Province’s announcement signals a continued shift toward consent-based decision-making in Indigenous territories. The AME, however, claims that the decision to launch this new process occurred without engagement or consultation with many of the companies who have mineral exploration projects or properties in the proposed area. In a statement issued June 19, AME board chair Trish Jacques said: “AME is concerned on behalf of our members in the region and across the province due to the continued erosion of certainty for mineral exploration activities.” “For the mineral exploration sector to be successful, investment in mineral exploration projects is required. It is unreasonable for the government to expect investment in the mineral exploration sector without ensuring certainty of land access, which is the foundational requirement to support the search for the critical minerals societies need,” Jacques added. The AME also called the new process a “distraction”, given that the Province must also focus on getting its land use planning processes right within the one-year timeline for the Northwest region, which was announced earlier this month. -
XRP Price At Risk Of 20% Crash To $1.55 If This Level Fails To Hold
um tópico no fórum postou Redator Radar do Mercado
XRP has once again landed at an important support level that places it in view of a rebound upwards or at risk of a further 20% crash. According to technical analyst CasiTrades, the recent drop was anticipated for weeks, and the precision with which XRP touched the $2.01 zone has added weight to its importance. The analyst noted that the drop out of the symmetrical triangle consolidation was clean and technically sound, and the $2.01 level has so far acted as the level for an upward bounce. Technical Setup Says Danger Zone Below $2.00 Still Active XRP price action in the past few days has been marked by a downtrend. XRP lost the $2.13 price level over the weekend before eventually cascading to a crash below $2 in the past 24 hours. Particularly, XRP crashed to bottom out at $1.92 before staging a rebound back above $2, at least at the time of writing. As it stands, XRP is now back to trading at $2.01, a price level that holds utmost importance for its price action in the coming days. According to a technical analysis posted on the social media platform X by crypto analyst CasiTrades, $2.01 is important for XRP, as it coincides with a major 0.618 Fib support level. Supporting this view is a visible bullish divergence forming on both the 15-minute and 1-hour Relative Strength Index (RSI), as depicted on the price chart below. However, the analyst was quick to warn that confirmation is still lacking on the higher 4-hour and daily timeframes. Without these confirmations, the bounce could still be nonexistent, and XRP could crash strongly below $2. XRP is currently at risk unless buyers manage to push its price into higher confirmation zones, specifically into the $3.00 range. According to CasiTrades, if any bounce at $2.01 fails to carry through, XRP could be headed for its next supports at $1.90 and then $1.55. The latter represents a rough 23% drop from current levels, a scenario that would invalidate the bullish RSI divergence on the smaller timeframes. Geopolitical Tensions Causing XRP Price Volatility The timing of XRP’s sharp drop over the weekend coincided with reports of geopolitical unrest, particularly the reported bombing of Iran by the US. This event caused widespread volatility in the crypto market, which was opened over the weekend. Although the decline seems to be pausing in recent trading hours, it does not yet qualify as a bounce. XRP price is currently fragile, and without a reaction from buyers or confirmation across higher timeframes, the structure is bearish. Selling pressure from new geopolitical tensions or algorithmic moves could potentially lead to deeper declines during the new week, especially if $2.00 fails to hold. In that case, XRP could be on track to retest the $1.90 support and even collapse toward the $1.55 before the end of the week. At the time of writing, XRP is trading at $2.01, down by 2.6% in the past 24 hours. -
Citizens stage rally for re-opening of Cobre Panama copper mine
um tópico no fórum postou Redator Radar do Mercado
Thousands of former workers, members of supplier companies and residents of the districts of La Pintada, Omar Torrijos and Donoso, staged a march on Sunday along the Pan-American Highway in the city of Penonomé to ask the government of President José Raúl Mulino to start negotiations with Minera Panamá, S.A. for the reopening of the giant Cobre Panama copper mine, local media El Capital Financiero reported. Minera Panamá is a subsidiary of the Canada’s First Quantum Minerals (TSX: FM), which operated the mine until Panama’s Supreme Court ruled its contract to operate the only mining operation in the Central American country, was unconstitutional in 2023. Challenges against the contract, which would have allowed Cobre Panama to keep operating for the next 20 years, piled up in court following public protests against the deal inked in October by the government and Minera Panamá. The demonstration on Sunday occupied a section of the Inter-American Highway in the direction of Nata de Los Caballeros, and took place peacefully, with a rally in which the sectors affected by the closure and their families participated, El Capital Financiero reported. Cecilia Martínez, a resident of the community of Coclesito in the Omar Torrijos Herrera district, told local media the residents of the areas adjacent to the Cobre Panama mine they participated in the demonstration to “demand their right to have a decent job”, “to contribute to the construction of a country that advances socially and economically in peace” and to reject the accusations of those who demonstrated against the mine as “sellouts of the homeland” for demanding “equal rights and opportunities” for those who reside in the rest of the country. Panama legislators had ratified the new contract between the executive and First Quantum, but reconsidered their decision after massive protests almost paralyzed the country. The land and sea ongoing demonstrations blocked the delivery of crucial supplies to the mine. Martínez told the news agency that after the closure of the Cobre Panama mine, local economies experienced a breakdown and left residents without opportunities to earn a livelihood. Meanwhile, Katherine Márquez, a former worker at the Cobre Panama mine, described to El Capital Financiero it was “shocking” to see how businesses, communities and people who were growing hand in hand with mining activity “have been left without dreams or opportunities” with the closure of the mine. Cobre Panama, Central America’s largest open-pit copper mine, produced 330,863 tonnes of copper in 2023 before the government ordered to shut it down. It would have become a 100 million tonnes a year operation in 2024, placing it near the top of the world’s copper throughput ranking. In April, a joint venture between First Quantum Minerals and the Panamanian government was presented as a practical solution to the dispute that has kept the Cobre Panama copper mine shut since November 2023. -
Dogecoin Crash Far From Over? Analyst Reveals The Target
um tópico no fórum postou Redator Radar do Mercado
The price of Dogecoin continues to bleed, and crypto analyst Kevin (@Kev_Capital_TA) warns that the worst may still lie ahead. Citing an earlier bearish pattern, Kevin emphasized over the weekend that Dogecoin’s Head and Shoulders formation—identified nearly two weeks ago—is rapidly approaching its technical “measured move” target. But he also made it clear that the full downside potential has not yet played out. Dogecoin Collapse Far From Over? “I didn’t say we are there now,” Kevin clarified in a follow-up post, “the orange circle represents a zone of where the measured move could go, with a precise measured move target of the .786 fib at .119.” This $0.119 level aligns with a broader confluence of technical supports that are quickly becoming critical for DOGE’s structure. “The Head n Shoulders I pointed out on Dogecoin almost a couple of weeks ago is almost at its measured move target range. Certain daily indicators are also starting to enter inciting levels. Watching closely along with BTC and USDT Dominance for further confirmations,” he wrote. Kevin also highlighted the importance of the weekly 200 Simple Moving Average (SMA) and Exponential Moving Average (EMA), along with the macro .382 Fibonacci retracement and a long-term descending trendline. Together, these levels form what he described as the “must-hold” zone, specifically between $0.1434 and $0.1265. A sustained breakdown below that region would likely confirm a macro bearish shift for the meme asset. What To Monitor Now Zooming out, Kevin sees Dogecoin’s fate as inseparably tied to Bitcoin and the wider altcoin market, which he describes as being in its weakest state in years. “So far 2025 has been more bearish for altcoins than 2024 and 2023,” he noted. “Worst year for Alts since the bear market in 2022.” The overwhelming strength of Bitcoin’s dominance has been a key factor in that trend. That dominance, Kevin argues, is not a temporary spike. “Fresh highs for BTC Dominance on the back of restrictive monetary policy and an uncertain geopolitical environment,” he wrote, referring to global macro conditions including persistent quantitative tightening (QT). He has long warned that without a pivot in central bank policy, any talk of a true “altseason” is premature. “Been saying since late 2023, early 2024—when AI coins were running crazy and people were saying it was #Altseason—that until QT ends and the terminal rate comes down, you will not see real sustainable altcoin outperformance. That continues to hold true.” His caution extends well beyond Dogecoin. In previous posts, Kevin identified key danger zones for Bitcoin and Ethereum, which he argues must be reclaimed to prevent broader market deterioration. “As long as BTC cannot break the $106.8K level and show real follow-through on 3D-1W time frames, then the market is in real danger,” he wrote. “Same for ETH not being able to break the $2700-2800 level.” For Dogecoin traders, the message is clear. The meme coin’s fate rests not just on its own technical health, but on a wider macro and intermarket structure that remains fragile. As long as Bitcoin struggles to hold above key breakout levels and US monetary conditions remain tight, the probability of a deeper Dogecoin correction remains high. Whether DOGE can stabilize above the $0.1265 level will be closely watched by traders in the days and weeks ahead. A loss of that zone, especially in conjunction with renewed Bitcoin weakness, could mark the beginning of a deeper and more painful phase for the once-beloved meme coin. At press time, DOGE traded at $0.152. -
Halliburton to design demonstration wells for GeoFrame Energy’s DLE project in Texas
um tópico no fórum postou Redator Radar do Mercado
Halliburton (NYSE: HAL) announced Monday it has secured a contract for GeoFrame Energy’s geothermal and direct lithium extraction (DLE) project in Texas. The company said it will plan and design the first demonstration phase wells in the Smackover Formation in East Texas. GeoFrame Energy has said it is set to become the first company to deliver battery-grade lithium carbonate from this US reservoir to the market. GeoFrame said the project is expected to produce approximately 83,500 metric tons of battery-grade lithium carbonate annually—enough to meet 100% of domestic demand – which would mark a turning point in ending US dependence on Chinese lithium imports. “GeoFrame Energy is in an excellent position to capitalize on the current demand for lithium through brine extraction,” Halliburton’s vice president of low carbon solutions Duane Sherritt said in a news release. “Halliburton’s 100-year legacy of well expertise and execution, combined with innovation to support new energy projects and decades of experience in the Smackover Formation, makes us the best candidate to help support GeoFrame Energy’s vision.” “Halliburton, as a critical member of our team, will support the drilling phase of our project through the construction, design, and operation of the demonstration wells and the expansion into full field development,” GeoFrame Energy CEO Bruce Cutright said. Cutright said the company plans to use geothermal brine to generate renewable electricity through zero-emission binary cycle generators. This process will power its direct lithium extraction and lithium carbonate production plant with renewable energy. The company will sell the excess geothermal power produced electricity to the grid. Work is expected to begin in late 2025. -
Market Wrap for the North American Session - June 23
um tópico no fórum postou Redator Radar do Mercado
Log in to today’s North American session Recap for June 23, 2025 Markets saw intense swings in sentiment and price action during today’s session. The Sunday evening open brought sharp gaps across multiple asset classes, including oil, equity indices, and major forex pairs. The most significant development came again from the Middle East, as Iran launched a ballistic missile strike targeting the Al-Udeid U.S. military base in Qatar—the largest American base in the region. All missiles were reportedly intercepted by Qatari air defenses. Markets interpreted the move as a largely symbolic gesture rather than a serious escalation. Initially, the attack triggered classic risk-off positioning, but sentiment quickly reversed as investors reassessed the limited impact. By the afternoon session, much of the early war-driven market reaction had been unwound. The U.S. Dollar played a central role in the day’s volatility, gapping higher at the open. The Dollar Index (DXY) surged to 99.40 during the Asian session—levels not seen since the end of May—before retracing sharply to close near 98.40. Read More: Oil retreats after a gap up as US Intervention sends markets into motion Opinions are the authors'; not necessarily that of OANDA Business Information & Services, Inc. or any of its affiliates, subsidiaries, officers or directors. The provided publication is for informational and educational purposes only. If you would like to reproduce or redistribute any of the content found on MarketPulse, an award winning forex, commodities and global indices analysis and news site service produced by OANDA Business Information & Services, Inc., please refer to the MarketPulse Terms of Use. Visit https://www.marketpulse.com/ to find out more about the beat of the global markets. © {CURRENT_YEAR} OANDA Business Information & Services Inc. -
Torex expands North American presence with $26M acquisition of Reyna Silver
um tópico no fórum postou Redator Radar do Mercado
Torex Gold Resources (TSX: TXG) has expanded its North American exploration portfolio with the acquisition of Reyna Silver (TSXV: RSLV) in an all-cash deal valued at C$36 million ($26 million). The acquisition, says Torex chief executive officer Jody Kuzenko, provides the company with “immediate access to new and exciting early-stage exploration projects within prolific mining camps in northern Mexico and Nevada.” In Nevada, Reyna has the option to acquire 70% of the Gryphon Summit project and 100% of the Medicine Springs project, both prospective for silver-lead-zinc-copper. Its Mexican assets, which are all 100% owned, include the Guigui and Batopilas projects located in Chihuahua state. Guigui is the flagship project, covering almost the entire Santa Eulalia mining district that produced more than 50 million tonnes at 310 grams silver per tonne, 8.2% lead and 7.1% zinc. “With the technical expertise and breadth of our exploration team, proven capability to deliver on major projects with the recent completion and commissioning of our Media Luna project … we are well-positioned to advance Reyna Silver’s properties and unlock the full value of these four projects,” Kuzenko added. Reyna Silver CEO Jorge Ramiro Monroy, commenting on the sale, said the “Torex offer allows these projects to remain as a portfolio and to have the necessary capital and expertise to move them to the next stage.” Transaction details Under the arrangement, Torex will acquire all of Reyna Silver’s share capital at a market value of C$0.13 per share. The consideration, totalling C$36 million, will be paid in cash. By Monday’s close, Reyna Silver traded at the offer price with a market capitalization of C$32.5 million ($24 million). Torex, meanwhile, rose 1.4% to C$44.17 apiece for a market capitalization of C$3.8 billion ($2.8 billion). Concurrent with the transaction, Torex has agreed to purchase units of Reyna Silver, also at market price, for a total investment of C$1.1 million. The proceeds, according to Reyna, will be used for payments relating to its option agreements in Nevada. Upon closing, Torex said it plans to build off the exploration and drilling programs undertaken by Reyna at its Mexican assets, and to conduct an evaluation on the properties in Nevada. The Toronto-based gold miner owns and operates the world-class Morelos mine complex located 180 km southwest of Mexico City. At an annual production of over 450,000 oz., the company is the largest gold producer in the country. The Morelos property covers the Media Luna underground, ELG underground and ELG open pit mines, a fully-integrated processing plant, and related infrastructure. A third underground deposit, EPO, is in the development stage and is expected to enter production in late 2026. -
Bitcoin Battles Key Support: Daily EMA-100 Must Hold to Prevent Deep Correction
um tópico no fórum postou Redator Radar do Mercado
Bitcoin briefly fell below the critical $100,000 level over the weekend, reaching a low of approximately $98,200 and triggering a wave of panic selling across crypto markets. The sharp drop came after news broke of US military strikes on Iranian nuclear facilities, a move that significantly escalated the already volatile conflict between Israel and Iran. The geopolitical shock sent global markets into risk-off mode, with Bitcoin reacting quickly to the growing uncertainty. Despite the weekend dip, BTC has since reclaimed the $100K mark, but sentiment remains fragile. Investors are now watching key technical levels closely to determine the next move. According to top analyst Ted Pillows, Bitcoin must hold the daily EMA-100 to avoid further downside pressure. A decisive close below this level could open the door for a deeper correction, especially if macroeconomic and geopolitical risks persist. As volatility spikes and fear grows, Bitcoin’s ability to maintain support at these levels may define whether the bull cycle continues or enters a prolonged consolidation phase. All eyes are now on the $100K zone, which has become a critical battleground for bulls and bears in a market driven by both technicals and global tension. Bulls Defend $100K As Dominance Rises and Market Faces Crucial Test Bitcoin is once again at a pivotal moment. After dipping below the psychological $100,000 level over the weekend amid growing geopolitical tensions, BTC quickly reclaimed this critical threshold, offering a glimmer of hope to market participants. Although bulls managed to push the price back up, the overall structure remains fragile, and technical indicators now carry more weight than ever. Ted Pillows noted in a recent update that Bitcoin must hold its daily EMA-100 to preserve bullish momentum. A daily close below $99,000 would confirm a break below this key support zone, likely triggering a retest of the $92,000–$94,000 region. Such a move could create significant downside pressure, particularly on altcoins, which are already lagging behind in performance. In Pillows’ words, “If Bitcoin loses this level, alts will be annihilated.” Despite the looming risks, fundamentals remain solid. Bitcoin dominance continues to hover near its highest levels of the year, reflecting growing investor preference for BTC over high-beta assets during uncertain times. On-chain metrics still indicate strong holder conviction, and macro narratives continue to favor Bitcoin as a hedge amid fiat instability and rising geopolitical uncertainty. If Bitcoin can hold the $100K level and reclaim momentum, it could lead to renewed strength and eventually a push toward the $109K resistance zone. For now, however, bulls are on the defensive. Price action over the next few days will likely define the trajectory for the remainder of Q3, with a close watch on EMA support, macro headlines, and risk sentiment across global markets. Bitcoin Struggles Below Resistance Amid Bearish Price Structure The 12-hour chart for Bitcoin reveals a bearish structure following the breakdown below the $103,600 support zone. After forming a symmetrical triangle throughout mid-June, BTC failed to break upward and instead reversed direction, confirming a downward breakout. This move triggered a sharp decline to $98,200 over the weekend, followed by a modest recovery to the current $101,250 level. The price is now trading below both the 50 and 100-period simple moving averages, which are beginning to curl downward, signaling a shift in momentum away from bulls. The 200-period SMA, currently near $95,600, stands as the next major support if downside pressure continues. Volume has picked up notably on the red candles, adding weight to the bearish case and confirming active selling during the recent drop. Bitcoin must reclaim the $103,600 zone and hold above it to invalidate the bearish pattern and regain control. Failure to do so could result in further downside toward $95,000 and possibly even $92,000. As long as BTC remains below the broken triangle support and the $103K resistance, the path of least resistance remains downward. Bulls face an uphill battle, and confidence may erode quickly if the $100K psychological level is breached again. Featured image from Dall-E, chart from TradingView -
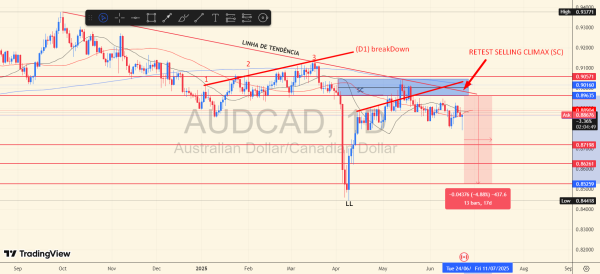 Perspectiva de análise breakDown após acumulação, retest em zona SC com possível alvo em Liquidity Grab -> (LL). Boas práticas: Stop Loss não deve ser maior que a alta da última vela antes (SC). O CHoCH 0.86261, após a liquidez deve ser quebrado em (D1) para que tenha sucesso na análise.
 -
Bitcoin segue tendência histórica da liquidez global M2, apesar de leve desvio
um tópico no fórum postou Igor Pereira Sentimento de Mercado
🔄 Bitcoin segue tendência histórica da liquidez global M2, apesar de leve desvio Por Igor Pereira | Analista de Mercado – ExpertFX School Apesar de uma leve divergência de curto prazo, o Bitcoin (BTC) permanece estruturalmente correlacionado à expansão da liquidez global M2, de acordo com dados apresentados por especialistas do mercado cripto nesta segunda-feira (23). Historicamente, o crescimento da oferta monetária M2 global tem se mostrado um dos principais vetores bullish (altistas) para o BTC, dada sua natureza de ativo escasso e não soberano. Em momentos de afrouxamento monetário, com ampliação do crédito e injeções de liquidez nos sistemas financeiros globais, o Bitcoin tende a se valorizar com mais força do que ativos tradicionais. 💡 O que é M2 e por que importa para o BTC? A base monetária M2 inclui dinheiro em circulação, depósitos à vista e depósitos de curto prazo — sendo um dos principais indicadores da liquidez sistêmica na economia global. Quando os bancos centrais expandem essa base, aumenta o volume de capital disponível nos mercados, o que historicamente impulsiona: Bolsas globais, Commodities, E especialmente ativos alternativos como o Bitcoin, que se posicionam como reserva de valor e proteção contra desvalorização fiduciária. 📉 Divergência recente: ruído ou sinal? Apesar de um leve desvio recente do BTC frente à curva de crescimento da M2, analistas destacam que o cenário macroeconômico continua favorável à retomada da correlação positiva. A recente volatilidade geopolítica no Oriente Médio, somada a expectativas de afrouxamento monetário nos EUA e China, tende a reacender o ciclo de expansão de liquidez. 🧭 O que esperar? A leitura institucional aponta que, caso o ciclo de política monetária global continue sinalizando redução de juros e ampliação do crédito, o BTC deve retomar o movimento altista em alinhamento com a curva da M2 global. Impacto nos mercados: BTC/USD: Expectativa de suporte técnico entre US$ 96.000 e US$ 101.000, com potencial de rompimento altista caso a liquidez global continue se expandindo. Altcoins: Ativos com menor capitalização podem reagir com maior volatilidade à expansão da M2. Mercado Tradicional: A revalorização do BTC em ambientes de afrouxamento monetário pode servir como termômetro do apetite por risco. 📊 Fique atento às atualizações macro e ao comportamento da M2 nos principais bancos centrais do mundo — como o Fed, o BCE e o PBoC —, pois são fundamentais para antecipar movimentos no mercado cripto. 📡 Para mais análises de liquidez, política monetária e impacto no Bitcoin, continue acompanhando o portal ExpertFX School. Igor Pereira Analista de Mercado | ExpertFX School | Membro WallStreet NYSE -
🇺🇸⚖️ Trump Intensifica Ataques ao Federal Reserve e Abala Confiança na Autonomia Monetária dos EUA Por Igor Pereira | Analista de Mercado - Membro WallStreet NYSE O presidente Donald Trump voltou a escalar seus ataques públicos contra o Federal Reserve, colocando a autoridade monetária americana em uma posição de extremo desconforto. Com críticas cada vez mais incisivas e pessoalizadas contra o presidente do Fed, Jerome Powell, Trump está forçando a instituição a escolher entre dois caminhos arriscados: cortar juros conforme exigido pelo governo, arriscando a credibilidade e alimentando a inflação, ou manter a atual postura cautelosa, enfrentando represálias políticas em meio ao risco de desaceleração econômica. 📉 Choque entre Política Monetária e Fiscal Trump quer que o Fed reduza agressivamente a taxa básica, hoje em torno de 4,3%, para um intervalo entre 1% e 2%, com o objetivo declarado de reduzir os custos crescentes com o serviço da dívida pública federal — que já se aproxima dos níveis de gasto com defesa. A motivação é dupla: impulsionar a economia em ano eleitoral e conter os custos de financiamento do Tesouro, em um contexto de déficits recordes. Powell, por sua vez, tem enfatizado que as decisões do Fed são técnicas e baseadas em dados. A pressão presidencial, contudo, é inédita em sua frequência, virulência e publicidade. Trump chegou a chamá-lo de “idiota total e completo” em redes sociais, além de cogitar abertamente sua substituição antecipada — o que encontra barreiras legais e institucionais. 📌 Impacto no Mercado e Risco de "Dominância Fiscal" Analistas alertam para o risco crescente de o Fed sucumbir à chamada fiscal dominance, quando a política monetária é subordinada à necessidade de financiar o Estado — cenário típico de países em desenvolvimento, mas até então impensável na maior economia do mundo. A credibilidade do dólar e dos Treasuries, que sustentam a ordem monetária global, estaria em risco caso a percepção de independência do Fed seja corroída. Em um contexto de alta incerteza, isso pode levar a uma reprecificação dos juros longos, mesmo que os juros curtos sejam cortados, refletindo um aumento no risco inflacionário e político. 📊 Divisão Dentro do Próprio Fed Nos últimos dias, dois diretores nomeados por Trump — Michelle Bowman e Christopher Waller — manifestaram abertura para cortes de juros já na reunião de julho, alegando preocupação com o enfraquecimento do mercado de trabalho. A mudança de tom reflete uma crescente politização interna do Comitê Federal de Mercado Aberto (FOMC), o que pode intensificar a fragmentação e confusão de sinais para os mercados. Ex-diretores como Kevin Warsh têm apontado que o Fed precisa mostrar força institucional diante das pressões. “Cresçam. Sejam duros. Isso faz parte do trabalho”, disse Warsh, cotado para substituir Powell em um eventual segundo mandato de Trump. 📅 O Futuro de Powell e o Risco de um "Presidente Sombra" Com o mandato de Powell terminando em menos de um ano, Trump cogita anunciar antecipadamente seu sucessor, criando uma figura de "presidente sombra" — uma estratégia para minar a autoridade do atual chairman e influenciar os mercados antes mesmo da transição oficial. Esse movimento, contudo, pode sair pela culatra: o sucessor ficaria em uma posição desconfortável, pressionado a criticar colegas e agradar politicamente ao presidente. Se defender a atual política do Fed, corre o risco de ser descartado antes mesmo de assumir o cargo. 🔍 O Que Esperar? O mercado global observa com atenção o desfecho desse embate entre o poder Executivo e o banco central mais influente do mundo. A depender dos próximos desdobramentos: O ouro (XAU/USD) pode seguir como principal ativo de hedge institucional contra instabilidade monetária. O dólar pode sofrer pressão estrutural se a percepção de risco político se acentuar. Mercados emergentes poderão enfrentar maior volatilidade cambial, dada a exposição ao dólar e aos Treasuries. A curva de juros americana pode se inclinar de forma atípica, com queda na ponta curta e alta na ponta longa — reflexo da perda de confiança. 📡 Acompanhe nossas atualizações diárias no site ExpertFX School, onde publicamos análises fundamentadas, com olhar técnico e institucional sobre os principais acontecimentos que movem os mercados globais. 🎯 Nosso compromisso é fornecer leitura precisa, contextualizada e estratégica — essencial para traders, investidores e analistas que desejam se antecipar às mudanças do ciclo macroeconômico. Igor Pereira Analista de Mercado | ExpertFX School | Membro WallStreet NYSE