

Todas Atividades
Atualizada automaticamente
- Recentemente
-
The British pound has stabilized on Wednesday and is trading at 1.3389 in the European session, up 0.07% on the day. This follows a four-day losing streak in which GBP/USD dropped 1.5%. On Tuesday, the pound fell as low as 1.3378, its lowest level since June 23. UK inflation hotter than expected Today's UK inflation report brought news that the Bank of England would have preferred not to hear. UK inflation in June jumped to 3.6% y/y, up from 3.4% in May and above the market estimate of 3.4%. This was the highest level since January 2024 and is a stark reminder that inflation is far from being beaten. The main drivers of inflation were higher food and transport prices. Services inflation, which has been persistently high, remained steady at 4.7%. Monthly, CPI ticked up to 0.3% from 0.2%, above the market estimate of 0.2%. It was a similar story for core CPI, which rose to 3.7% y/y from 3.5% in May, above the market estimate of 3.5%. Monthly, core CPI climbed 0.4%, above 0.2% which was also the market estimate. Opinions are the authors'; not necessarily that of OANDA Business Information & Services, Inc. or any of its affiliates, subsidiaries, officers or directors. The provided publication is for informational and educational purposes only. If you would like to reproduce or redistribute any of the content found on MarketPulse, an award winning forex, commodities and global indices analysis and news site service produced by OANDA Business Information & Services, Inc., please refer to the MarketPulse Terms of Use. Visit https://www.marketpulse.com/ to find out more about the beat of the global markets. © {CURRENT_YEAR} OANDA Business Information & Services Inc.
- Hoje
-

Citigroup CEO Confirms Interest In Issuing A Proprietary Stablecoin—Reuters
um tópico no fórum postou Redator Radar do Mercado
American multinational investment bank Citigroup announced plans to potentially issue its stablecoin, as CEO Jane Fraser revealed during a post-earnings conference call. As first reported by Reuters, Fraser emphasized the bank’s focus on both the stablecoin initiative and the growing tokenized deposit sector, stating, “This is a good opportunity for us.” As the third-largest lender in the United States, Citigroup is also exploring solutions for reserve management related to stablecoins and providing custody services for cryptocurrency assets. Citigroup’s Plan For New Stablecoin Initiative This announcement follows a strong second-quarter performance for Citigroup, which saw its shares reach their highest levels since the 2008 financial crisis. The bank reported earnings that exceeded Wall Street expectations and unveiled plans to buy back at least $4 billion in stock, further bolstering investor confidence. The timing of Citigroup’s stablecoin discussions coincides with the Republican Party’s “Crypto Week,” a campaign aimed at advancing crucial legislation to establish a regulatory framework for digital assets. Among the key proposals is the GENIUS Act, designed to facilitate the adoption of stablecoins within the traditional financial ecosystem. However, the path to regulatory approval has faced challenges. Legislative Setback For Crypto President Donald Trump called for swift passage of the GENIUS Act and the CLARITY Act, promoting them as pivotal for the United States to maintain its leadership in digital assets. In a Tuesday post on Truth Social, Trump proclaimed: The House will soon VOTE on a tremendous Bill to Make America the UNDISPUTED, NUMBER ONE LEADER in Digital Assets – Nobody does it better! The GENIUS Act is going to put our Great Nation lightyears ahead of China, Europe, and all others, who are trying endlessly to catch up, but they just can’t do it. Digital Assets are the FUTURE, and we are leading by a lot! Get the first Vote done this afternoon (ALL REPUBLICANS SHOULD VOTE YES!). Despite this push, the House of Representatives voted against the bill, with the final tally standing at 196-223. Notably, 13 Republican representatives joined Democrats in opposing the motion, marking a rare instance of dissent within the party. Fox journalist Eleanor Terret reported that some House members expressed concerns that the GENIUS Act could inadvertently pave the way for a Central Bank Digital Currency (CBDC). However, the bill includes provisions explicitly prohibiting the Federal Reserve from directly offering services to the public, ensuring that it cannot authorize initiatives like digital wallets or personal accounts related to CBDCs. The ultimate fate of these crucial crypto bills in the US Congress remains to be seen, as does whether this recent decision will cause financial giants to pause their plans to issue or adopt a major stablecoin for their clients. Featured image from DALL-E, chart from TradingView.com -
Bitcoin Falls Below $117,000 Amid $3.5 Billion Profit-Taking Frenzy
um tópico no fórum postou Redator Radar do Mercado
The Bitcoin price has slipped under $117,000 as on-chain data shows the network has observed one of its largest profit realization days of the year. Bitcoin Long-Term Holders Did The Major Share Of Profit-Taking In a new post on X, the on-chain analytics firm Glassnode has talked about the latest trend in the Bitcoin Realized Profit indicator for the short-term holders and long-term holders. The “Realized Profit” measures, as its name suggests, the total amount of profit that the BTC investors are realizing through their transactions. The metric works by going through the transfer history of each coin being sold to see what price it was moved at prior to this. The difference between that previous price and the current selling price denote the amount of profit or loss involved in the sale. Naturally, the sale realizes a gain if the difference is positive. The Realized Profit adds up this value involved in all transactions of the type occurring on the blockchain. Another indicator known as the Realized Loss keeps track of the sales of the opposite type. In the context of the current discussion, the Realized Profit of two specific segments of the sector is of interest: short-term holders (STHs) and long-term holders (LTHs). Investors are divided into these groups based on the basis of holding time. More particularly, holders who have been carrying their coins for 155 days or less are put in the STHs and those who have made it past this threshold are considered LTHs. Below is the chart shared by Glassnode that shows the trend in the Realized Profit for the two sides of the Bitcoin market. As displayed in the graph, the Bitcoin Realized Profit has seen spikes for both of these groups during the last 24 hours, implying investors across the market have harvested gains taking advantage of the rally to the new all-time high (ATH) above $123,000. In total, the holders took profits equal to $3.5 billion inside this window, making the profit-taking event one of the largest for the year. Interestingly, the LTHs occupied for a higher share ($1.96 billion or 56%) of the profit realization than the STHs ($1.54 billion or 44%). Generally, the longer an investor holds onto their coins, the less likely they become to sell them. As such, the LTHs with their relatively long holding time are considered to represent the resolute side of the market. Despite their strong resolve, however, it seems the latest Bitcoin price surge provided a temptation strong enough for even these diamond hands to be swayed. The result of the selloff has so far appeared to be a price decline to levels below $117,000. BTC Price At the time of writing, Bitcoin is floating around $116,700, up over 7% in the last week. -
All major US indices closed lower on Tuesday, 15 July, except for the Nasdaq 100, which rose 0.1% thanks to Nvidia’s continued strength. The S&P 500 hit a fresh intraday all-time high of 6,302 early in the session but reversed gains to end down 0.4%. Small caps were hit hardest, with the Russell 2000 falling 2%, while the Dow Jones Industrial Average lost 1%. Disappointing earnings also weighed on sentiment. JP Morgan declined 0.7%, Wells Fargo plunged 5.5%, and BlackRock slid 5.9% after reporting Q2 results. The Dow underperformed due to its higher exposure to financials. Read more in our previous Chart of the day – Dow Jones Industrial Average at risk of a minor corrective decline close Fig 2: US Nasdaq 100 CFD Index minor trend as of 16 July 2025 (Source: TradingView) Fig 2: US Nasdaq 100 CFD Index minor trend as of 16 July 2025 (Source: TradingView) Despite the last two sessions of outperformance seen on the Nasdaq 100 against the other major US stock indices (S&P 500, DJIA, Russell 2000), technical analysis suggests that the US Nasdaq 100 CFD Index is likely due for at least an imminent minor corrective decline sequence within its medium-term uptrend phase. Since 3 July, the price actions of the US Nasdaq 100 CFD Index has consolidated and stalled at the upper boundary of a long-term secular ascending channel in play since the March 2020 low, Only for the first time on Tuesday, 15 July, since the consolidation started on 3 July, the US Nasdaq 100 CFD Index has formed a daily bearish reversal “Gravestone Doji” candlestick pattern after a failed intraday push above the upper boundary of the long-term secular ascending channel (see Fig 2). These observations suggest a potential “bullish exhaustion” moment on the US Nasdaq 100 CFD Index in light of Nvidia’s (a significant component stock of Nasdaq 100) positive news flow that allowed it to sell lower-grade H20 chips to China. Watch the 22,920/23,020 pivotal resistance, and a break below 22,600 is likely to expose the next intermediate support zone of 22,390/22,235 in the first step. However, a clearance above 23,020 invalidates the bearish scenario to resume the bullish impulsive up move sequence for the next intermediate resistances to come in at 23,190, and 23,400/23,480 (defined by Fibonacci extension cluster levels). Opinions are the authors'; not necessarily that of OANDA Business Information & Services, Inc. or any of its affiliates, subsidiaries, officers or directors. The provided publication is for informational and educational purposes only. If you would like to reproduce or redistribute any of the content found on MarketPulse, an award winning forex, commodities and global indices analysis and news site service produced by OANDA Business Information & Services, Inc., please refer to the MarketPulse Terms of Use. Visit https://www.marketpulse.com/ to find out more about the beat of the global markets. © {CURRENT_YEAR} OANDA Business Information & Services Inc.
-
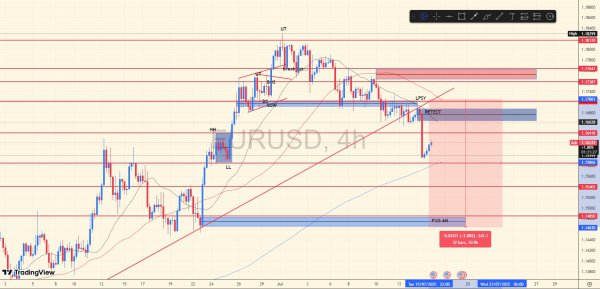 Perspectiva de análise RETEST em zona LPSY após SOW quebrado, e continuação para FVG 4H. Stoploss não deve ser maior que o último spring 4H vermelho (zona vermelha/acima entrada)
 -
SUI Eyes 140% Move As Price Reclaims $4 – New ATH Imminent?
um tópico no fórum postou Redator Radar do Mercado
SUI is attempting to reclaim a crucial resistance level after its massive performance over the past few weeks. As it breaks out of a triangle formation, some analysts suggest that a rally to a new all-time high (ATH) could be around the corner. SUI Breaks Out Of Multi-Month Pattern On Tuesday, SUI broke above the $4.00 resistance for the first time since May, hitting a two-month high of $4.10. The altcoin has seen an 81% surge over the past three weeks, recovering from the June retracement and setting up for a rally continuation. Notably, SUI ended its multi-month downtrend at the end of March, breaking above its descending resistance and jumping to its $4.29 high in May. Following the Q2 breakout, the cryptocurrency has been trading within the $2.33-$4.10 range. However, last month’s market pullback sent the token from its key $3.00 mid-range support to its three-month low of $2.22 before the recent recovery. Since then, SUI has reclaimed the mid-range area and skyrocketed toward the range high as Bitcoin’s (BTC) ATH rally leads the market. Over the past 24 hours, SUI has soared nearly 15% from the $3.50 support toward the $4.00 resistance, breaking out of a triangle formation and potentially setting the stage for a massive breakout. Analyst Ali Martinez affirmed that the altcoin’s bullish price action could push its price to a new ATH as it has broken out of a multi-month symmetrical triangle pattern over the past few days and attempts to turn the next key level into support. According to the market watcher, SUI finally broke above the descending resistance after reclaiming the $3.50 area on Monday and could target a 140% move to the $7.60 area if there’s a spike in buying pressure. Similarly, analyst Nebraskangooner highlighted that reclaiming the $4.00 resistance will propel the cryptocurrency to a new ATH. This level has been a crucial support since the Q3 2024 rally and a key resistance area after the early 2025 pullbacks. Is A Double-Digit Rally Coming? Crypto Bullet noted that SUI has entered its Wave 3, which eyes a double-digit target for the cryptocurrency. The analyst previously explained that the altcoin had a “clear 1-5 impulse off the April’s low – higher degree Wave (1),” before entering the corrective Wave 2 between late May and Early June. However, “Wave 2 took longer and went deeper than expected (obviously due to the situation in the Middle East).” After the recent breakout, SUI has entered the long-awaited Wave 3, with a 51% increase so far, and a target above the $10 mark, the analyst detailed. Additionally, he pointed to SUI’s trading pair against Solana (SOL), as the weekly chart “Looks like a breakout is imminent.” The altcoin is currently retesting a crucial resistance level against SOL, which could lead to a breakout to the 0.0470 area. “In the coming weeks, SUI will just crush Solana,” Crypto Bullet forecasted. Meanwhile, Crypto Kaleo affirmed that the cryptocurrency has continued its bounce on its trading pair against BTC. At the start of the month, the analyst highlighted that SUI had bounced from its BTC and USD pairs, becoming one of the leading altcoins. “BTC ratio chart looks ready to rip out of the wedge it’s been accumulating in since the beginning of 2025. Up only,” he concluded. As of this writing, SUI is trading at $3.96, a 3% increase in the daily timeframe. -
Crypto Bulls Rejoice: Congresswoman Confirms Powell’s Imminent Firing
um tópico no fórum postou Redator Radar do Mercado
A single-word reply on X from Rep. Anna Paulina Luna (R‑FL) — “Confirmed” — rocketed through the crypto markets early Wednesday, convincing a growing chorus of traders that Federal Reserve Chair Jerome Powell’s tenure is measured in days, not months. Within minutes of Luna’s affirmation that “Jerome Powell is going to be fired. Firing is imminent,” prediction‑market odds of his ouster on Polymarket leapt to 26 percent, the highest reading this year, up from 16 percent only 24 hours earlier. A White‑House‑backed search is already under way. Treasury Secretary Scott Bessent, in an on‑record Bloomberg interview, acknowledged “a formal process that’s already starting” to identify Powell’s successor, adding that “there are a lot of good candidates inside and outside the Federal Reserve.” President Donald Trump underscored the point during an impromptu press gaggle, repeating last week’s warning that “the renovations at the central bank were a fireable offense.” Those renovations — an over‑budget, $2.5 billion overhaul of the Fed’s historic Eccles Building — have become the legal pretext for dismissal, with Trump allies alleging “inefficiency” and “neglect of duty,” two of the three causes for removal spelled out in the Federal Reserve Act. Powell has asked the Fed’s inspector general to reopen its review of the project. Notably, Bill Pulte, the Federal Housing Finance Agency head and a longtime Powell critic, confirmed the rumors to his followers on X: “I heard from a very credible, bipartisan source, today, that Jerome Powell is considering resigning. This maps with both reports and also the talk in DC.” Crypto Markets Sense A Massive Bull Run The Bitcoin and crypto prices haven’t shown any reaction to the rumor yet. After piercing $123,000 on Monday, BTC is still 4.5 percent below the record high. The entire crypto market seems to be in a wait-and-see position. However, long-term, the implication could be profound for the crypto markets. “I cannot think of a more bullish catalyst for Bitcoin in the past five years than the complete and utter humiliation of Jerome Powell,” wrote macro commentator Julian Figueroa, pointing to what he called the “façade” of central‑bank independence collapsing in real time. Long‑time trader Byzantine General echoed the ambivalence: “Powell was actually a great Fed chair. But… if he resigns then it’s very likely that whoever comes next will lower rates, which is bullish for our cryptographic currencies.” Should President Trump succeed in replacing Powell with a more accommodating successor—one prepared to deliver the “three‑percentage‑point” rate cut he has publicly demanded—the Federal Reserve would likely be forced to shelve its balance‑sheet runoff precisely as Washington ramps up fresh fiscal stimulus. That synchronous pivot away from quantitative tightening would flip the liquidity regime from drain to deluge, recreating the macro backdrop that powered the crypto market’s 2020‑21 vertical ascent and positioning it for the next major bull run. At press time, the total crypto market cap stood at $3.68 trillion. -
Breaking News: UK Inflation Hits 3.6% Beating Forecasts, GBP Bid
um tópico no fórum postou Redator Radar do Mercado
Most Read: WTI Oil Advances as 200-day MA Serves as Support, Chinese Imports Soar The Bank of England has a new headache to deal with as headline inflation rose to 3.6%, its highest in over a year. The figure came in higher than the 3.4% which was economists expectations based on a Reuters poll. Services price inflation, which the Bank of England sees as a better indicator of local price pressures than overall CPI, stayed at 4.7% in June, defying economists' expectations of a drop to 4.6%. close Source: TradingView.com Source: TradingView.com For a more in depth look at the technical picture for GBP/USD, Please read GBP/USD Vulnerable as Trendline Break Sets Up Potential 600 Pip Drop Follow Zain on Twitter/X for Additional Market News and Insights @zvawda Opinions are the authors'; not necessarily that of OANDA Business Information & Services, Inc. or any of its affiliates, subsidiaries, officers or directors. The provided publication is for informational and educational purposes only. If you would like to reproduce or redistribute any of the content found on MarketPulse, an award winning forex, commodities and global indices analysis and news site service produced by OANDA Business Information & Services, Inc., please refer to the MarketPulse Terms of Use. Visit https://www.marketpulse.com/ to find out more about the beat of the global markets. © {CURRENT_YEAR} OANDA Business Information & Services Inc. -
Dormant Bitcoin Wallet Moves $1.2B in BTC: Is A Major Sell-Off Coming?
um tópico no fórum postou Redator Radar do Mercado
Bitcoin’s recent price momentum has encountered a pause following the latest US Consumer Price Index (CPI) release, which showed inflation rising to 2.7% in June. The inflation increase appears to have affected investor sentiment. After reaching a new high above $123,000 on Monday, Bitcoin has since declined by roughly 5.4% from that peak, with its price currently trading just above $116,000. The broader crypto market also reacted to the news, with the global crypto market cap valuation dropping by nearly 7% in the past day amid renewed uncertainty about future interest rate policy. While Bitcoin has exhibited a strong uptrend in recent weeks, the latest pullback introduces short-term volatility that analysts are watching closely. One particularly notable development occurred on-chain: a transfer of 10,000 BTC, valued at roughly $1.2 billion, from a dormant address last active over a decade ago. Historic Bitcoin Transfer Raises Eyebrows, but No Signs of Exchange Activity CryptoQuant analyst Carmelo Alemán shared insights into the large transaction in a recent post titled “10,000 Historic BTC Move On-Chain.” According to Alemán, the transaction occurred on July 14 at 16:17 UTC, moving 10,000 BTC from address ‘bc1q84…7ef6k ‘ to ‘bc1qmu….8v2p.’ These coins had not moved in over 10 years, indicating they likely originated from early miners during Bitcoin’s earliest phases when the block reward was 50 BTC. Alemán noted that such old unspent transaction outputs (UTXOs) often trigger concern about potential sell-offs, but in this case, further analysis suggests a more neutral interpretation. The movement of old coins can occur for various reasons, including UTXO consolidation, wallet upgrades, or potential sales. Alemán explained that this transfer displayed characteristics consistent with consolidation for efficiency and security purposes. For example, the transaction used 16 different inputs, which can help reduce future transaction fees. Additionally, no corresponding inflow to centralized exchanges (CEXs) was detected, typically a key signal when holders intend to liquidate. The analyst also pointed out that two small test transactions were sent to the receiving address before the full transfer. These included a 0.00089 BTC and a 1 BTC transaction, commonly used to verify wallet accessibility before moving a large sum. Interestingly, two hours after the initial transaction, the same destination wallet received another transfer of 10,009 BTC, bringing the total to more than 20,000 BTC moved in the span of a few hours. Implications for Market Behavior and On-Chain Trends While the transaction did not lead to immediate market selling, it has added to ongoing discussions about the role of long-term holders in Bitcoin’s supply dynamics. Large transfers from early addresses are rare and often interpreted as strategic reorganization of funds. Alemán noted that the absence of exchange-related activity makes it unlikely that the coins are being liquidated in the short term. However, he cautioned that such movements warrant continued monitoring, particularly if additional large transfers follow or if the recipient wallet later transacts with exchanges. Featured image created with DALL-E, Chart from TradingView -
BNB Price Stalls: Struggles to Resume Gains While Altcoins Rally
um tópico no fórum postou Redator Radar do Mercado
BNB price is correcting gains from the $708 zone. The price is now facing hurdles near $692 and might dip again toward the $675 support. BNB price is attempting to recover from the $675 support zone. The price is now trading below $690 and the 100-hourly simple moving average. There is a key bearish trend line forming with resistance at $692 on the hourly chart of the BNB/USD pair (data source from Binance). The pair must stay above the $680 level to start another increase in the near term. BNB Price Faces Hurdles After a steady increase, BNB price failed to clear the $710 zone. There was a downside correction below the $690 and $680 levels, unlike Ethereum and Bitcoin. The price even dipped below $678 and tested $675. A low was formed at $674 and the price is now attempting to recover. There was a move above $680. The price climbed above the 50% Fib retracement level of the downward move from the $707 swing high to the $674 low. However, the bears are active near $692. There is also a key bearish trend line forming with resistance at $692 on the hourly chart of the BNB/USD pair. The price is now trading below $690 and the 100-hourly simple moving average. On the upside, the price could face resistance near the $692 level. The next resistance sits near the $695 level or the 61.8% Fib retracement level of the downward move from the $707 swing high to the $674 low. A clear move above the $695 zone could send the price higher. In the stated case, BNB price could test $708. A close above the $708 resistance might set the pace for a larger move toward the $720 resistance. Any more gains might call for a test of the $732 level in the near term. Another Decline? If BNB fails to clear the $692 resistance, it could start another decline. Initial support on the downside is near the $682 level. The next major support is near the $680 level. The main support sits at $674. If there is a downside break below the $674 support, the price could drop toward the $665 support. Any more losses could initiate a larger decline toward the $650 level. Technical Indicators Hourly MACD – The MACD for BNB/USD is losing pace in the bullish zone. Hourly RSI (Relative Strength Index) – The RSI for BNB/USD is currently below the 50 level. Major Support Levels – $685 and $680. Major Resistance Levels – $692 and $708. -
What was meant to be a big legislative moment for crypto policy ran into a wall on Tuesday. Three major digital asset bills got stopped cold in the House after a group of 13 Republicans broke ranks and joined Democrats to block a key procedural vote. That vote was needed to move forward with debate and final approval. The bills included the GENIUS Act for stablecoin rules, a bill on market structure, and one aimed at blocking a government-backed digital dollar. Why the Package Collapsed The main sticking point came down to how the bills would be handled. Some Republicans pushed for all three to be combined into one package, which would have triggered a longer process involving the Senate. House leadership, backed by Trump, wanted individual votes to fast-track passage. That split caused the vote to fail 196 to 223. With that, the day’s crypto momentum ground to a halt. Trump Tries to Rally Support Trump has been vocal about making the US a leader in digital assets and threw his support behind the legislation. After the vote failed, he brought lawmakers to the White House to regroup. Later, he posted that 11 of the 12 holdout Republicans had agreed to move forward with a new vote the next day. Whether that happens remains to be seen. DISCOVER: Best New Cryptocurrencies to Invest in 2025 Crypto Markets React to Uncertainty For the industry, this isn’t just a political scuffle. The GENIUS Act would introduce rules for reserve backing and transparency that many stablecoin issuers have asked for. When the vote failed, markets didn’t like the uncertainty. Shares of crypto firms like Coinbase and Circle dropped by about 4 percent before stabilizing. Bitcoin also dipped before recovering some ground. BitcoinPriceMarket CapBTC$2.34T24h7d30d1yAll time Fractures in the Republican Ranks This episode exposed real tension inside the GOP. Some lawmakers want to move quickly on digital asset policy, while others are more hesitant or want broader negotiations. Even with Trump’s backing, the internal disagreement was enough to stall the entire effort. It’s a reminder that party unity does not always guarantee results. DISCOVER: 20+ Next Crypto to Explode in 2025 Can the Bills Be Revived? House leadership says they are not done. There may be another attempt this week, or they could try again after the next recess. Staff on both sides of the Capitol are likely already working on new angles. But time is tight, and the longer this drags out, the more uncertain the outlook becomes for crypto regulation in 2025. It’s Not Over Yet: What the Delay Means This isn’t just about three bills. It’s about whether Washington can provide clarity on stablecoins, market infrastructure, and future digital currency efforts. Other countries are moving forward with their own frameworks. If the US falls too far behind, the impact could stretch beyond policy and into innovation and investment. Crypto Week may have stalled, but it is far from over. The next few days will show whether lawmakers can pull together and deliver something concrete or whether this becomes another case of political promises running into reality. DISCOVER: 20+ Next Crypto to Explode in 2025 Join The 99Bitcoins News Discord Here For The Latest Market Updates Key Takeaways Crypto Week hit a wall after the House failed to pass a key procedural vote, blocking three major digital asset bills from moving forward. The vote collapsed due to internal GOP disagreements over whether to fast-track individual bills or bundle them into one larger package. Trump backed the legislation and tried to rally support after the vote failed, but it’s unclear if a new vote will happen this week. The market reacted to the uncertainty, with stocks like Coinbase and Circle falling around 4 percent and Bitcoin briefly dipping. Lawmakers say they’re not giving up, but the delay adds more uncertainty to U.S. crypto regulation heading into 2025. [/key_takeaways_list] [/key_takeaways] The post Crypto Week Stalls Out as House Vote Fails appeared first on 99Bitcoins.
-
 📉 Análise Técnica do Ouro (XAU/USD): Mercado em Consolidação com Tendência Ainda Indefinida Por Igor Pereira – Analista de Mercado Financeiro | Membro Junior WallStreet NYSE Após duas sessões consecutivas de correção, o ouro ($XAU/USD) continua operando em uma faixa de preço estreita, evidenciando uma clara acumulação lateral no gráfico diário. O cenário técnico atual não oferece ainda um direcionamento firme, e o mercado segue em compasso de espera por um catalisador que possa definir uma nova tendência. 🔍 Condições Técnicas Atuais O metal tentou, sem sucesso, romper o BOS (Break Market Structure) $3368, ponto que serviu como resistência imediata. A rejeição nesta zona desencadeou uma movimentação descendente que levou o preço a se aproximar do suporte de US$ 3.317. 🎯 Próximos Níveis-Chave a Observar 📈 Cenário de Alta Para que o ouro possa engatar um novo ciclo de alta no curto prazo, será essencial que o preço rompa novamente a zona de (BOS) resistência técnica dos US$ 3.370. Nesse caso, os alvos técnicos mais imediatos são: US$ 3.400 – resistência horizontal e objetivo de curto prazo. US$ 3.430+ – resistência dinâmica e possível extensão do movimento comprador. 📉 Cenário de Baixa Por outro lado, uma nova queda abaixo do BOS (Break Market Structure) Minor em US$ 3.300 (D1) pode sinalizar uma retomada da fraqueza, com espaço técnico para uma correção mais ampla. Nesse cenário, os principais alvos seriam: US$ 3.246 – alinhado à retração no gráfico semanal, configurando um ponto crítico de inflexão. US$ 3.200 – fundo da estrutura lateral e último suporte relevante antes de uma mudança de viés mais agressiva. 🧭 Indicadores Técnicos RSI (Índice de Força Relativa): O RSI oscila em torno da linha de 50, o que reforça o comportamento de indecisão do mercado. A ausência de divergências claras ou rompimentos de zonas extremas indica que os players institucionais estão aguardando definição macroeconômica ou fluxo relevante. Volume e volatilidade: Ambos permanecem comprimidos, compatíveis com uma fase de acúmulo institucional. 📌 Conclusão do Analista Igor Pereira 🧭 O que Esperar do Mercado? Volatilidade moderada até rompimentos técnicos Movimentos agressivos podem surgir com dados macro dos EUA Foco institucional entre US$ 3.246 e US$ 3.400 📢 Para análises completas e alertas em tempo real sobre ouro (XAU/USD), entre agora para o Clube Profissional da ExpertFX School.
 -
JPMorgan and Citi Explore Stablecoins as Digital Payments Grow In Popularity
um tópico no fórum postou Redator Radar do Mercado
Two of the world’s largest banks are stepping further into the stablecoin world. JPMorgan and Citigroup are both exploring how these digital assets could become part of mainstream finance, and this time, it is more than just talk. On recent earnings calls, JPMorgan CEO Jamie Dimon and Citigroup CEO Jane Fraser confirmed that their institutions are actively developing or evaluating stablecoin projects. Dimon Steps Off the Sidelines Jamie Dimon has been skeptical of stablecoins for years. He has often questioned why anyone would choose them over standard bank transfers or payment apps. Now, that position is starting to change. JPMorgan already has an internal deposit token called JPMD, which runs on its Base blockchain and is used for select institutional transactions. Now, the bank plans to begin testing external stablecoins as well. Dimon said the move is about staying ahead. Fintech competitors are building digital payment tools that offer faster settlement and global reach. JPMorgan is not waiting around to see how it all plays out. It wants to be involved early enough to understand what works and what doesn’t. Citigroup Explores Its Own Stablecoin Jane Fraser is taking a similar approach. While Citigroup has so far focused on tokenized deposits, Fraser confirmed that the bank is looking into launching a Citi-branded stablecoin. The project is still in its early stages, but the idea is gaining traction internally. Citi analysts believe the stablecoin market could be worth over three trillion dollars by the end of the decade. That forecast has added urgency to Fraser’s push to explore digital payment rails and new ways of offering liquidity. DISCOVER: 9+ Best High-Risk, High-Reward Crypto to Buy in July2025 Why It Matters These aren’t just tech experiments. Banks have been wary of stablecoins for years, mainly because of unclear regulations and concerns over compliance. Now, with legislative efforts picking up in Washington, including the proposed GENIUS Act, the environment is starting to change. BitcoinPriceMarket CapBTC$2.34T24h7d30d1yAll time Dimon made it clear that regulation is still a major factor. Without strong legal guardrails, large banks are unlikely to move beyond pilots. But having a plan in place gives them the option to move quickly once the path becomes clearer. Fraser linked Citi’s work on digital assets to a wider effort that includes custody services and digital reserve management. For both banks, this is about preparing for a future where money moves differently. DISCOVER: Next 1000X Crypto: 10+ Crypto Tokens That Can Hit 1000x in 2025 Other Banks Are Getting Involved JPMorgan and Citi are not the only ones paying attention. Earlier this year, banks including Bank of America and Wells Fargo joined discussions about a possible joint stablecoin project. That initiative is still in the idea phase, but it shows that interest is growing across the board. What Comes Next Both banks are likely to continue testing quietly while monitoring the regulatory front. JPMorgan may begin integrating select third-party stablecoins in small use cases, while Citigroup might focus on building internal infrastructure to support a future launch. Stablecoins are no longer something the big banks are ignoring. With real money flowing into the space and fintechs moving fast, traditional finance is starting to make its move. Whether these projects reach consumers soon or remain behind the scenes, it is clear that the stablecoin conversation has reached a new level. DISCOVER: 20+ Next Crypto to Explode in 2025 Join The 99Bitcoins News Discord Here For The Latest Market Updates Key Takeaways JPMorgan and Citigroup are actively exploring stablecoins, moving beyond research and into early development and testing phases. Jamie Dimon confirmed JPMorgan will begin testing external stablecoins, a change from his previous skepticism. Citigroup is evaluating a Citi-branded stablecoin, with internal momentum building around future digital payment infrastructure. Both banks are preparing for a regulated future, keeping pace with fintechs and global stablecoin trends while awaiting clearer rules. Other major banks, including Bank of America and Wells Fargo, are also exploring joint stablecoin initiatives, signaling wider industry interest. [/key_takeaways_list] [/key_takeaways] The post JPMorgan and Citi Explore Stablecoins as Digital Payments Grow In Popularity appeared first on 99Bitcoins. -
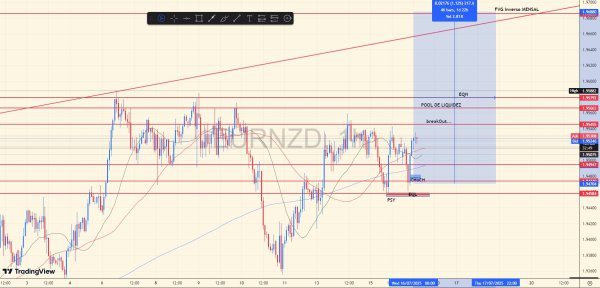 Perspectiva de análise RETEST em zona CHoCH (mudança de tendência), em direção a breakOut zona para quebra e continuação a EQH e possível continuação para filtrar lacuna FVG mensal. Stoploss não deve ser maior que a área em vermelho.
 -
⚠️ Wall Street alerta: Tesouro dos EUA pode aumentar risco fiscal com excesso de T-Bills Por Igor Pereira – Analista de Mercado Financeiro | Membro Junior WallStreet NYSE A recente sinalização do Tesouro dos EUA sobre uma possível mudança estrutural no financiamento do déficit — com foco mais intenso na emissão de T-Bills (títulos de curtíssimo prazo) — acendeu alertas em Wall Street. Segundo estrategistas do BNY Mellon e do Deutsche Bank, essa dependência de dívida de curto prazo pode gerar riscos sérios ao equilíbrio fiscal e à autonomia do Federal Reserve, com repercussões diretas sobre o ouro, o dólar e o Bitcoin. 🏦 O que está acontecendo? Durante a pesquisa trimestral com dealers primários, o Tesouro questionou sobre a capacidade do mercado de absorver volumes maiores de T-Bills sem distorções nos preços. Essa atitude foi interpretada como um sinal claro de aumento da emissão desses papéis nos próximos meses, principalmente após a aprovação do plano de estímulo fiscal batizado de "One Big Beautiful Bill". Atualmente, os T-Bills representam cerca de 20% da dívida pública negociável, mas essa fatia pode crescer significativamente com o objetivo de recompor o caixa federal, sem elevar ainda mais os juros da parte longa da curva. 💡 Por que isso preocupa o mercado? Embora T-Bills sejam baratos de emitir no curto prazo, seu uso excessivo amplia o risco de refinanciamento ("rollover risk"), tornando a dívida pública extremamente sensível a elevações nos juros. Isso pode obrigar o Fed a manter os juros artificialmente baixos para não colapsar as contas públicas — cenário conhecido como dominância fiscal, no qual a política monetária se torna refém da política fiscal. Além disso, como 23% da demanda por T-Bills é estrangeira, qualquer redução nesse fluxo, por motivos geopolíticos ou técnicos, pode pressionar o dólar, os juros e os mercados globais. 📊 Impactos no mercado financeiro 🟡 Ouro (XAU/USD): Beneficiário direto da dominância fiscal Em um ambiente onde o Fed perde autonomia e o risco fiscal aumenta, o ouro tende a se valorizar como proteção contra desvalorização do dólar e instabilidade monetária. A dependência de dívida curta pode gerar pressão inflacionária futura, aumentando o apelo por ativos reais e não indexados como o ouro. O suporte técnico permanece em US$ 3.300, enquanto analistas como Goldman Sachs mantêm projeção de US$ 4.000 até meados de 2026, reforçando o viés estrutural de alta. 💵 Dólar (DXY): Pressão estrutural de longo prazo Apesar do DXY estar atualmente em 98.02 pontos, a mudança no perfil da dívida pública pode comprometer a credibilidade do dólar como ativo livre de risco. Se o Fed for percebido como submisso às demandas fiscais da Casa Branca, o dólar poderá enfrentar fuga de capitais estrangeiros, principalmente de detentores de Treasuries. Isso tende a acelerar movimentos de desdolarização por parte de bancos centrais, aumentando a pressão no médio e longo prazo. ₿ Bitcoin (BTC/USD): Forte atratividade institucional A perda de confiança nos instrumentos de dívida e no dólar tradicional tende a favorecer o fluxo de capital institucional para ativos escassos como o BTC. Com o BTC cotado hoje em US$ 117.116, analistas como Bitwise já projetam preços de até US$ 150.000, baseados no “choque de oferta”: ETFs e fundos comprando mais do que os mineradores conseguem produzir. Empresas como BlackRock, Fidelity e agora a própria Vanguard estão aumentando suas posições via ETFs spot, reforçando a tese de que o BTC está se tornando uma reserva institucional de valor frente ao colapso da política monetária tradicional. 🔎 Conclusão do analista Igor Pereira 📌 Quer acesso às análises institucionais completas e oportunidades nos mercados de ouro e cripto? ➡️ Entre para o Clube Profissional da ExpertFX School e receba análises técnicas, níveis-chave e alertas ao vivo diariamente.
-
Bitcoin Profit-Taking Spikes Without Price Drop – Strong Demand Or Delayed Reaction?
um tópico no fórum postou Redator Radar do Mercado
Bitcoin’s (BTC) on-chain activity has accelerated over the past few days, with the leading cryptocurrency by market cap hitting successive new all-time highs (ATHs). As a result, several metrics now indicate renewed interest from both long-term holders and recent participants. Older Bitcoin Moves Amidst High Profit-Taking According to a CryptoQuant Quicktake post by contributor Kripto Mevsimi, Bitcoin’s Coin Days Destroyed (CDD) has surged significantly over the past week. The metric climbed to 28 million, signalling that older BTC – dormant for extended periods – has begun moving again. For the uninitiated, Bitcoin CDD measures the movement of older coins by multiplying the number of coins moved by how long they were held. A spike in CDD indicates that long-dormant Bitcoin is being spent or transferred, often signaling strategic shifts by long-term holders. Historical data shows that CDD spikes typically precede strategic shifts – often large holders either redistributing supply or repositioning portfolios. Such activity commonly appears near cycle midpoints or local tops. Besides the rising CDD, Bitcoin Net Realized Profit and Loss (NRPL) has also recorded a steep climb. The metric recently surged past $4 billion, the highest level since Q2 2025. To explain, Bitcoin NRPL measures the difference between the price at which coins were bought and the price at which they are sold or moved on-chain. A high positive NRPL indicates investors are realizing profits, while a negative NRPL suggests widespread selling at a loss, often tied to market fear or capitulation. As NRPL hits levels not seen since early Q2 2025, it suggests that Bitcoin whales and recent buyers are actively taking profits. Despite the increased profit-taking, BTC’s price has remained relatively stable, trading between $116,000 and $120,000. The lack of a sharp price pullback amid such profit-taking points to two possible scenarios – either demand remains strong enough to absorb sell pressure, or a delayed correction could be on the horizon. The analyst noted: Interestingly, this current wave differs from late June. Back then, NRPL showed a mix of realized losses and modest profits – suggesting capitulation from late buyers while older holders quietly accumulated. Today, the narrative flips: profits dominate, while older coins flow. Exchange Data Suggests Warning For BTC While the absence of a sharp decline despite significant realized profits may signal strong underlying demand, recent exchange data raises some concerns. Notably, Bitcoin inflows to crypto exchanges have seen a sharp uptick. Conversely, other sentiment-tracking indicators suggest that despite BTC’s new highs, retail hype remains subdued – unlike in previous ATH phases – implying potential for further upside. At press time, BTC trades at $116,760, down 2.6% in the past 24 hours. -
XRP Price Eyes Fresh Gains: Traders Bullish After Momentum Spike
um tópico no fórum postou Redator Radar do Mercado
XRP price started a fresh increase and traded above the $3.00 zone. The price is now correcting gains and might find bids near the $2.840 support zone. XRP price started a fresh increase above the $2.880 zone. The price is now trading above $2.840 and the 100-hourly Simple Moving Average. There is a key bullish trend line forming with support at $2.880 on the hourly chart of the XRP/USD pair (data source from Kraken). The pair could start another increase if it stays above the $2.840 zone. XRP Price Retains Gains XRP price started a fresh increase after it settled above the $2.750 level, like Bitcoin and Ethereum. The price was able to climb above the $2.850 resistance level. The recent move was positive and the bulls pushed the price above the $3.00 level. A high was formed at $3.0324 and the price is now correcting gains. There was a move below $2.90 level, and the price spiked below the 50% Fib retracement level of the upward move from the $2.660 swing low to the $3.0324 high. However, the bulls were active near the $2.80 support zone. There is also a key bullish trend line forming with support at $2.880 on the hourly chart of the XRP/USD pair. The price is now trading above $2.850 and the 100-hourly Simple Moving Average. On the upside, the price might face resistance near the $2.9450 level. The first major resistance is near the $3.00 level. A clear move above the $3.00 resistance might send the price toward the $3.080 resistance. Any more gains might send the price toward the $3.120 resistance or even $3.150 in the near term. The next major hurdle for the bulls might be near the $3.20 zone. Downside Break? If XRP fails to clear the $2.9450 resistance zone, it could start another decline. Initial support on the downside is near the $2.880 level and the trend line zone. The next major support is near the $2.840 level. If there is a downside break and a close below the $2.840 level, the price might continue to decline toward the $2.750 support. The next major support sits near the $2.650 zone. Technical Indicators Hourly MACD – The MACD for XRP/USD is now losing pace in the bullish zone. Hourly RSI (Relative Strength Index) – The RSI for XRP/USD is now above the 50 level. Major Support Levels – $2.880 and $2.840. Major Resistance Levels – $2.950 and $3.00. -
Ethereum Flexes Muscle, Outperforms Bitcoin Amid Market Momentum
um tópico no fórum postou Redator Radar do Mercado
Ethereum price started a fresh increase above the $3,020 zone. ETH is now consolidating gains and might correct lower toward the $3,040 zone. Ethereum started a fresh increase above the $3,040 level. The price is trading near $3,050 and the 100-hourly Simple Moving Average. There was a break above a bearish trend line with resistance at $2,990 on the hourly chart of ETH/USD (data feed via Kraken). The pair could start a fresh increase if it remains supported above the $3,000 zone in the near term. Ethereum Price Extends Gains Above $3,000 Ethereum price started a fresh increase above the $2,880 zone, outperforming Bitcoin. ETH price gained pace for a move above the $2,950 resistance zone and entered a positive zone. The bulls even pumped the price above $3,050. There was a break above a bearish trend line with resistance at $2,990 on the hourly chart of ETH/USD. Finally, it tested the $3,150 zone. A high was formed at $3,152 and the price is now consolidating gains above the 23.6% Fib retracement level of the upward move from the $2,935 swing low to the $3,152 high. Ethereum price is now trading above $3,000 and the 100-hourly Simple Moving Average. On the upside, the price could face resistance near the $3,120 level. The next key resistance is near the $3,150 level. The first major resistance is near the $3,220 level. A clear move above the $3,220 resistance might send the price toward the $3,300 resistance. An upside break above the $3,300 resistance might call for more gains in the coming sessions. In the stated case, Ether could rise toward the $3,420 resistance zone or even $3,450 in the near term. Are Downsides Limited In ETH? If Ethereum fails to clear the $3,150 resistance, it could start a downside correction. Initial support on the downside is near the $3,100 level. The first major support sits near the $3,040 zone. A clear move below the $3,040 support might push the price toward the $3,000 support. Any more losses might send the price toward the $2,950 support level in the near term. The next key support sits at $2,880. Technical Indicators Hourly MACD – The MACD for ETH/USD is gaining momentum in the bullish zone. Hourly RSI – The RSI for ETH/USD is now above the 50 zone. Major Support Level – $3,000 Major Resistance Level – $3,150 -
World Gold Council projeta estabilidade nos preços do ouro com potencial alta de até 5% no segundo semestre O World Gold Council (WGC), autoridade global em pesquisa e análise do mercado de ouro, divulgou recentemente sua visão para o desempenho do ouro na segunda metade de 2025. Segundo o WGC, os preços do ouro devem permanecer dentro do atual intervalo de negociação, mas existe possibilidade de valorização de até 5% caso o cenário macroeconômico global se mantenha estável. O que esperar? O relatório aponta que, diante da atual conjuntura econômica mundial — marcada por tensões comerciais moderadas, inflação controlada e políticas monetárias cautelosas — o ouro tende a oscilar em uma faixa relativamente estável. No entanto, fatores como: Manutenção das políticas de estímulo pelos bancos centrais; Continuidade das tensões geopolíticas localizadas; Flutuações moderadas nas taxas de juros reais; Podem servir como catalisadores para uma leve alta no preço do metal precioso. Impactos no mercado financeiro Essa perspectiva de estabilidade com leve valorização reforça o papel do ouro como ativo de proteção e reserva de valor em um ambiente de incertezas globais. Para traders e investidores, o cenário sugere: Oportunidades para estratégias de médio prazo aproveitando a consolidação dos preços; Atenção ao acompanhamento de indicadores macroeconômicos que possam gerar volatilidade; Valorização gradual da demanda física e institucional, especialmente por parte de bancos centrais. 📌 Por Igor Pereira – Analista de Mercado Financeiro | Membro Junior WallStreet NYSE ExpertFX School – Conteúdo técnico e análise institucional para traders e investidores.
-
Bitwise projeta Bitcoin entre US$ 140.000 e US$ 150.000 com modelo de “choque de oferta” A gestora de ativos digitais Bitwise divulgou recentemente uma projeção otimista para o Bitcoin (BTC), apontando que o ativo pode alcançar rapidamente a faixa entre US$ 140.000 e US$ 150.000, conforme seu modelo de “choque de oferta”. O que é o “choque de oferta”? Este conceito refere-se a uma pressão de compra muito superior à velocidade com que novos Bitcoins são minerados e disponibilizados no mercado. A Bitwise destaca dois pontos principais: Grandes investidores institucionais, como corporações e fundos de ETFs, estão adquirindo BTC em volume e ritmo muito superiores à oferta minerada diariamente; Os detentores de longo prazo (long-term holders) têm retirado suas moedas das exchanges, reduzindo ainda mais a liquidez disponível para venda. Esse desequilíbrio cria um ambiente de escassez relativa, impulsionando a valorização do Bitcoin. O que esperar? Se essa dinâmica se mantiver, o Bitcoin poderá enfrentar uma pressão compradora contínua, com pouca liquidez para conter a alta dos preços. A projeção da Bitwise sugere um movimento expressivo no curto a médio prazo, com forte tendência de valorização. Porém, esse cenário também demanda cautela, pois: Alta volatilidade pode ocorrer devido à concentração da oferta; Movimentos especulativos podem intensificar correções abruptas; Regulamentações e eventos macroeconômicos ainda são fatores de risco relevantes. Impacto no mercado financeiro Para o mercado de criptomoedas, essa perspectiva reafirma o papel crescente do Bitcoin como ativo de reserva e porto seguro digital. Além disso: A corrida institucional por BTC pode reduzir a liquidez e aumentar o risco de squeezes de preço; Outros ativos digitais podem ser impactados pela movimentação do capital para o Bitcoin; No contexto macro, investidores devem monitorar o BTC como indicador de apetite por risco e como possível proteção contra a inflação e desvalorização das moedas fiduciárias. 📌 Por Igor Pereira – Analista de Mercado Financeiro | Membro Junior WallStreet NYSE ExpertFX School – Conteúdo técnico e análise institucional para traders e investidores.
-
JPMorgan anuncia entrada no mercado de stablecoins para ampliar expertise
um tópico no fórum postou Igor Pereira Sentimento de Mercado
JPMorgan anuncia entrada no mercado de stablecoins para ampliar expertise O CEO do JPMorgan Chase, um dos maiores bancos dos Estados Unidos e do mundo, revelou recentemente a estratégia da instituição de ingressar no setor de stablecoins, moedas digitais lastreadas em ativos reais, para entender melhor o funcionamento deste mercado e posicionar-se como um player profissional no segmento. O que esperar dessa movimentação? O movimento do JPMorgan reflete a crescente importância das stablecoins no sistema financeiro global, especialmente após avanços regulatórios nos EUA e maior adoção institucional das criptomoedas. Com sua experiência e infraestrutura robusta, o banco busca: Desenvolver produtos financeiros integrados que utilizem stablecoins como meio de liquidação; Atender clientes institucionais que demandam soluções digitais estáveis para pagamentos e investimentos; Aumentar a competitividade frente a outras instituições que já atuam no mercado cripto. Impacto no mercado financeiro A entrada de um gigante bancário como o JPMorgan no setor de stablecoins pode acelerar a legitimidade e adoção destas moedas digitais, trazendo maior segurança e liquidez ao ecossistema cripto. Para o mercado financeiro tradicional, isso representa: Pressão regulatória para padronização e supervisão das stablecoins; Novas oportunidades para integração entre o sistema bancário tradicional e o mercado de ativos digitais; Potencial aumento na eficiência das operações de câmbio e pagamentos internacionais. Do ponto de vista do investidor, a profissionalização do setor de stablecoins pode reduzir riscos sistêmicos, elevar a transparência e ampliar a oferta de produtos financeiros lastreados em criptoativos. 📌 Por Igor Pereira – Analista de Mercado Financeiro | Membro Junior WallStreet NYSE ExpertFX School – Conteúdo técnico e análise institucional para traders e investidores. -
Bitcoin OG Whale Moves 40,000 BTC To Galaxy, Triggering Market Shock
um tópico no fórum postou Redator Radar do Mercado
A single wallet that has sat untouched since 2011 jolted the market overnight, wiring 40,009 BTC—worth roughly $4.68 billion at prevailing prices—to New York‑based trading giant Galaxy Digital. The address had held 80,009 BTC in total and had never previously moved funds in the modern era. According to on‑chain sleuth Lookonchain, “the Bitcoin OG with 80,009 BTC ($9.46 B) has transferred 40,009 BTC ($4.68 B) to Galaxy Digital,” and Galaxy “has directly deposited 6,000 BTC ($706 M) into Binance and Bybit.” Bitcoin OG Whale Awakens The activity began late Monday evening (UTC). First, 9,000 BTC—about $1.06 billion—left the dormant wallet, followed an hour later by another 7,843 BTC ($927 million) Over the next five hours several smaller tranches arrived at Galaxy Digital’s custodial accounts before the decisive push that brought the running total to 40,009 BTC. Blockchain explorers show the coins originated from a bech32 address that first received block rewards in early 2011, when bitcoin changed hands for less than one US dollar. Notably, Galaxy Digital operates one of the largest over‑the‑counter (OTC) desks in the industry and regularly intermediates block trades for institutions seeking to avoid slippage on public venues. The firm advertises “premier execution” and bespoke liquidity provisioning for trades that are too large for order‑book execution. On‑chain analysts therefore read the wallet’s choice of counterparty as a signal that the owner intends to liquidate at least part of the hoard discreetly rather than deploy it into DeFi or cold storage. Within hours of receiving the coins, Galaxy split 6,000 BTC between Binance and Bybit, the two venues that currently post the deepest spot‑BTC liquidity. Bitcoin had just printed an all‑time high of $123,153 on 14 July, buoyed by Washington’s “Crypto Week” legislative push. As the OG whale’s transactions hit public mempools, spot prices recoiled more than 6%, sliding from $123,000 to an intraday low near $115,700 before stabilising around $116,900 at press time. With half of the stash now under Galaxy’s control and only a fraction confirmed as exchange deposits, traders are bracing for further transfers. If Galaxy executes an OTC cross, the impact could be muted; if the coins bleed into order books, bids at $112,000‑$115,000 will face a major test. US Inflation Data Dampens Sentiment However, today’s price drop can not solely be attributed to the OG whale’s doing; it coincided with the US Bureau of Labor Statistics’ June CPI print, which showed headline consumer prices rising 0.3 % month‑on‑month and 2.7 % year‑on‑year—up from 2.4 % in May—while core CPI ticked up 0.2 % on the month and 2.9 % on the year. The modest print pushed the dollar index above 95.5, and risk assets have been whipsawing ever since. “The price action on the dollar pretty much tells you everything you need to know about this CPI report—mixed and the market is trying to digest it and to figure out the direction today,” observed Daan Crypto Trades on X. At press time, BTC stood at $116,972. -
Bitcoin Price Dips — Is This the Calm Before the Surge or the Storm?
um tópico no fórum postou Redator Radar do Mercado
Bitcoin price started a downside correction from the $123,200 zone. BTC is now trading below $120,000 and might find bids near the $115,500 zone. Bitcoin started a fresh decline from the new all-time high near $123,200. The price is trading below $120,000 and the 100 hourly Simple moving average. There was a break above a bearish trend line with resistance at $117,300 on the hourly chart of the BTC/USD pair (data feed from Kraken). The pair might start another increase if it clears the $120,000 resistance zone. Bitcoin Price Corrects From New ATH Bitcoin price started a fresh increase after it cleared the $118,500 resistance zone. BTC gained pace for a move above the $120,000 and $122,000 resistance. The bulls even pumped the pair above the $123,000 zone. A new all-time high was formed at $123,140 and the price is now correcting gains. There was a move below the 23.6% Fib retracement level of the upward move from the $108,636 swing low to the $123,140 high. Bitcoin is now trading below $120,500 and the 100 hourly Simple moving average. However, the price is holding the 50% Fib level of the upward move from the $108,636 swing low to the $123,140 high. Besides, there was a break above a bearish trend line with resistance at $117,300 on the hourly chart of the BTC/USD pair. Immediate resistance on the upside is near the $118,500 level. The first key resistance is near the $120,000 level. The next resistance could be $122,000. A close above the $122,000 resistance might send the price further higher. In the stated case, the price could rise and test the $123,200 resistance level. Any more gains might send the price toward the $125,000 level. The main target could be $130,000. More Losses In BTC? If Bitcoin fails to rise above the $120,000 resistance zone, it could continue to move down. Immediate support is near the $115,850 level. The first major support is near the $115,500 level. The next support is now near the $114,150 zone. Any more losses might send the price toward the $112,500 support in the near term. The main support sits at $110,500, below which BTC might continue to move down. Technical indicators: Hourly MACD – The MACD is now losing pace in the bearish zone. Hourly RSI (Relative Strength Index) – The RSI for BTC/USD is now below the 50 level. Major Support Levels – $115,500, followed by $114,150. Major Resistance Levels – $120,000 and $122,000. -
If You’re Wealthy, 1 Bitcoin Should Already Be In Your Wallet, Expert Says
um tópico no fórum postou Redator Radar do Mercado
Bitcoin climbed past $122,000 this week, marking its fourth straight month of gains. It even touched $123,000 Monday before dipping slightly. Prices like these put the crypto asset well beyond what many everyday earners can afford. According to the Social Security Administration, the average yearly salary in the US is $66,600. That means a single coin now costs nearly twice what a typical worker makes in a full year. Bitcoin Prices Soar Past Records Based on reports from top crypto channel Altcoin Daily, high‑net‑worth individuals are being urged to act fast. The platform tweeted that millionaires should consider buying at least 1 BTC now, while it’s still within reach. This warning follows a popular post from El Salvadorian President Nayib Bukele, who pointed out that not all millionaires will be able to pick up a whole Bitcoin. With just 21 million BTC ever to exist and over 50 million millionaires worldwide, grabbing even 0.5 BTC would be out of reach if everyone tried. Supply Crunch And Demand Rising According to Bloomberg Terminal data, traders are already thinking in terms of “millions per coin.” That shift reflects growing expectations that Bitcoin will surge into seven‑figure territory. United States President Donald Trump’s second son, Eric Trump, recently said that half a Bitcoin will be a huge amount of money soon and predicted the crypto could hit $1 million in the mid‑term. Those comments add to a chorus of bullish voices. Millionaires Feel The Squeeze Based on analysis from Binance co‑founder Changpeng Zhao, the $1 million mark isn’t far off. He told investors that it could happen in this bull cycle. Brandon Green of BTC Inc. agreed, forecasting a similar timeframe for liftoff. If those estimates hold, owning less than a coin may soon feel like holding pocket change. Big Names Project Massive Gains Ark Invest has put a $1.5 million base‑case target on Bitcoin by 2030, with a $2.4 million bull case riding on more institutional and nation‑state buying. That study credits a supply squeeze and wider adoption as key drivers. Meanwhile, Michael Saylor, who chairs Strategy, has set his sights even higher. He raised his forecast to $13 million per coin by 2045, citing rapid regulatory clarity and fast‑tracking corporate investment. Bold Forecasts Paint A High Stakes Picture Some of these price targets may sound lofty. Yet they reflect a simple math problem: shrinking supply meets growing demand. Fractional ownership allows small investors to chip in over time, but the sense of urgency is hard to ignore. For now, Bitcoin’s rally is rewriting affordability rules, and the window for easy access may be closing. Featured image from Meta, chart from TradingView -
A crypto analyst who accurately predicted the Bitcoin (BTC) price surge to $120,000 months ago has returned with a bold new forecast that could redefine investors’ expectations for the rest of the cycle. Using a detailed Elliott Wave structure and historical halving patterns, the expert outlines what could be Bitcoin’s final parabolic move, laying out a clear roadmap toward a new ATH target. Bitcoin Parabolic Phase Still Ahead Following Bitcoin’s explosive rise above $123,000 in a single day, crypto analyst XForceGlobal reaffirmed his earlier predictions and intensified his bullish outlook. He now asserts that Bitcoin is in the early stages of a much larger breakout, with the final and most parabolic phase of its rally yet to unfold. The analyst Bitcoin Price Trajectory To $155,000: Why No Major Dips Are Expected From Here a detailed chart showing that Bitcoin is now trading over $40,000 above its Wave 2 bottom of the macro 5th. This indicates that the market could be transitioning into Wave 3 of a larger Elliott Wave impulse pattern. The chart also visually segments previous bull market runs into distinct macro phases, each unfolding after a halving cycle. Every phase began with a consolidation period, followed by exponential growth and eventual correction. Bitcoin’s price history is further marked by the halving events in 2012, 2016, 2020, and 2024—all of which have consistently preceded major bullish rallies. The latest halving, which occurred in April 2024, is now expected to lead to an intermediate-term rally that may extend BTC’s price beyond $270,000 before entering another corrective phase. While XForceGlobal maintains a bullish long-term outlook for Bitcoin, he urges investors to be cautious and aware that the final wave may generate market euphoria before a significant decline sets in. His projected roadmap shows a steady bullish climb toward $272,832, followed by a potential retracement to around $41,646, marking a steep 85% crash from the top. During his analysis, the market expert highlighted the difference between smart and dumb money during this bullish phase of the cycle. He claimed that smart investors have already mapped out their exit strategies, understanding that success comes from early planning rather than spontaneous decisions. He also added that with the market yet to reach a climax, there’s still time to prepare an exit before red flags emerge. Analyst Predicts $155,000 As Bitcoin’s Next Stop In a follow-up X post, XForceGlobal forecasted Bitcoin’s next short-term price target at $155,000. This prediction comes as BTC recently rallied past $123,000 before undergoing a pullback, now trading slightly above $116,800. According to the analyst, Bitcoin remains firmly in an extended Wave 3, which traditionally represents the most impulsive and powerful phase of the Elliott Wave sequence. XForceGlobal’s chart reveals that Bitcoin recently broke out from a complex WXYXZ correction structure, which served as the launchpad for the present rally. His projection suggests that BTC is now forming a five-wave structure targeting the $140,000-$155,000 range, with macro-level corrections expected along the way.