

Todas Atividades
Atualizada automaticamente
- Recentemente
-
The Japanese yen has started the week with strong gains. In the European session, USD/JPY is trading at 147.71, down 0.73% on the day, Japanese PM on shaky ground after election drubbing Japanese Prime Minister Ishiba's ruling coalition failed to win a majority in the election for the upper house of parliament on Sunday. The result is a humiliating blow to Ishiba, as the government lost its majority in the lower house in October. The stinging defeat could be the end of the road for Ishiba. The Prime Minister has declared he will remain in office, but there is bound to be pressure from within the coalition for Ishiba to resign. Opinions are the authors'; not necessarily that of OANDA Business Information & Services, Inc. or any of its affiliates, subsidiaries, officers or directors. The provided publication is for informational and educational purposes only. If you would like to reproduce or redistribute any of the content found on MarketPulse, an award winning forex, commodities and global indices analysis and news site service produced by OANDA Business Information & Services, Inc., please refer to the MarketPulse Terms of Use. Visit https://www.marketpulse.com/ to find out more about the beat of the global markets. © {CURRENT_YEAR} OANDA Business Information & Services Inc.
-

Not Even Bitcoin Is Safe: Kiyosaki Warns Of Massive Market Collapse
um tópico no fórum postou Redator Radar do Mercado
Veteran investor Robert Kiyosaki has sounded a stark warning for markets that have just seen Bitcoin hit a fresh all‑time high of $123,000. According to Kiyosaki, long‑running bubbles in the US economy are primed to burst, and Bitcoin could slide right along with stocks and bonds. The cryptocurrency is already off its peak, trading past the $118,000 mark after profit‑taking by long‑term holders. Major Debt And Sticky Inflation Based on reports, the US national debt has climbed to over $36 trillion, a level few would have imagined a decade ago. At the same time, June’s Consumer Price Index shows inflation isn’t cooling as fast as hoped. Those figures have left many investors on edge. Kiyosaki, who has championed Bitcoin as a hedge against currency weakness, believes these pressures will trigger a broad market pullback. He warned that gold, silver and Bitcoin may see sharp corrections when the wider “bubbles” finally burst. Still, he made it clear he views any drop as a chance to buy more. Whales Move To Exchanges On‑chain data tell a similar story of caution. According to Glassnode, the 7‑day simple moving average of whale‑to‑exchange transfers is approaching 12,000 BTC—the highest level seen in 2025 so far. That surge mirrors activity from November 24, 2024, when large holders began shifting coins onto trading platforms to lock in gains. Bitcoin has already climbed over 50% since its April lows, so some pullback was almost inevitable. Miners have also started moving coins, suggesting they too are taking profits. Firms Double Down On Bitcoin Institutional appetite remains strong, even amid talk of a crash. Twenty‑one firms added roughly $810 million of Bitcoin to their balance sheets last week alone as part of their treasury plans. Spot Bitcoin ETFs are still drawing steady inflows, offering a regulated path for investors to gain exposure. Those continued purchases could soften the blow if a bigger sell‑off takes hold. Market observers see a tug‑of‑war playing out. On one side, big holders are cashing in after a historic rally. On the other, companies and funds are piling in, betting that any dip will be short‑lived. Short‑term traders may try to ride the volatility. Long‑term backers, like Kiyosaki, are eyeing deeper discounts before they pull the trigger on new buys. The coming weeks could test Bitcoin’s resilience. If debt concerns and stubborn inflation dominate headlines, volatility may spike. Yet the ongoing institutional support and Kiyosaki’s buy‑the‑dip stance hint that any slide could set the stage for a fresh rally. Featured image from Meta, chart from TradingView - Hoje
-
Asia Pacific stock markets opened the week on a mixed note. Singapore’s Straits Times Index (STI) led the pack, surging 0.5% intraday to a new all-time high of 4,225, breaking above the psychological 4,200 mark and continuing its bullish run. close Fig 2: Gold (XAU/USD) minor trend as of 21 July 2025 (Source: TradingView) Fig 2: Gold (XAU/USD) minor trend as of 21 July 2025 (Source: TradingView) The recent minor sideways range compression of Gold (XAU/USD) in place since 3 July has reached a potential tipping point for at least a minor breakout scenario. Two key elements have increased the odds of a bullish breakout scenario. Firstly, Gold (XAU/USD) has retested the medium-term ascending trendline support in place since 31 December 2024 low for the third time on last Thursday, 21 July. Secondly, in conjunction with the third retest on the medium-term ascending trendline support of Gold (XAU/USD), the hourly MACD trend indicator has traced a bullish divergence condition on 17 July, inched higher, and staged a MACD-Signal line bullish crossover in today’s Asia session at this time of writing. Watch the US$3,328 short-term pivotal support, and a clearance above US$3,374 upside trigger level may see a minor bullish breakout unfolding for the next intermediate resistances to come in at US$3,400 and US$3,450 in the first step. On the flip side, failure to hold at US$3,328 invalidates the bullish scenario for another round of minor choppy corrective decline sequence to expose the next intermediate supports at US$3,309, and US$3,293/3,282. Opinions are the authors'; not necessarily that of OANDA Business Information & Services, Inc. or any of its affiliates, subsidiaries, officers or directors. The provided publication is for informational and educational purposes only. If you would like to reproduce or redistribute any of the content found on MarketPulse, an award winning forex, commodities and global indices analysis and news site service produced by OANDA Business Information & Services, Inc., please refer to the MarketPulse Terms of Use. Visit https://www.marketpulse.com/ to find out more about the beat of the global markets. © {CURRENT_YEAR} OANDA Business Information & Services Inc.
-
XRP Targets $6–$10 If Bitcoin Hits $144,000, Analyst Predicts
um tópico no fórum postou Redator Radar do Mercado
Pseudonymous market technician Dr Cat has laid out a tightly argued roadmap that would see XRP triple from its current range to between six and ten dollars within the next two months—provided Bitcoin’s ongoing advance carries the benchmark asset to $144,000. XRP Poised For $10 If This Happens In a series of posts over the weekend, the analyst noted that XRP’s monthly chart against BTC is “coiling” just beneath a crucial Ichimoku Cloud threshold at 2,674 satoshis. “If this month closes above 2 674 I think we should go at least to 4 135 in the next couple of months,” Dr Cat wrote, adding that such a close would deliver the first bullish monthly kumo twist for the pair since 2018 and place XRP in a “support‑and‑regain” configuration rarely seen in altcoins during the current cycle. The 4,135–7,600 satoshi band marks what Dr Cat calls the “resistance / take‑profit zone.” He argues that price seldom reloads immediately after such a multi‑year breakout and that a wick to the upper end of the zone is likely once momentum ignites. “All in all, if BTC goes to 144 K on this weekly move, this price range for XRP in USD translates to $6–$10,” the analyst told followers, pencilling the move in for August or September if Bitcoin’s trend steepens. Dr Cat conceded that the optimal risk‑reward evaporates above 7,600 sats—“Would you risk a 10× unrealised gain for another 0.7×?”—and said he would rotate out of the position even though longer‑term targets above $30 remain “plausible” into 2026. On the XRP‑USD chart the picture is similarly constructive. Sunday’s weekly close above $3.37 turned both the cloud and the Kijun‑sen higher and produced a textbook Chikou Span breakout in week 27 of the Ichimoku time cycle, the so‑called Henka‑Bi candle. Dr Cat’s price‑projection grid aligns traditional Fibonacci extensions with Ichimoku price‑measurement theory: the N‑wave objective sits at $4.53, the E‑wave at $6.31 and the 2E extension at $9.22. “With the condition of this weekly close all of them are on the table for the next one to two months and $4.5 should be the absolute minimum,” he wrote, recalling that the same $4.5 target had been floated as “minimum” when XRP traded at $1.89 in early April. Market context lends partial support to the thesis. Bitcoin is trading just above $118,500 after a subdued weekend session, consolidating a 20 percent rally since the start of July, while ether holds near $3,760 and dominance continues to erode in favour of large‑cap altcoins. XRP itself is hovering around $3.55 following a 50‑percent weekly burst. Technically, the “monthly close above 2,674 sats” remains the gating criterion. A failure to secure that level would postpone the kumo twist and risk another quarter of range‑bound drift versus Bitcoin. Conversely, a decisive move into the 4,135–7,600 satoshi band would confirm the first bullish market‑structure shift on the long‑term ratio chart in seven years and almost certainly drive speculative flows into the XRP‑USD pair. Traders watching for additional confirmation will be tracking whether the Chikou Span can clear price on the weekly timeframe “this or next week”—a rare but powerful signal that the analyst warns could invalidate the “healthy cross” caveat and send the market vertical even before the textbook Tenkan‑Kijun crossover materialises. For now, the path to $6–$10 hinges on Bitcoin’s ability to extend its breakout toward the six‑figure mark. If the flagship asset stalls below $120,000 the proportional upside for XRP compresses; should the rally continue, Dr Cat’s stacked Ichimoku‑Fibonacci objectives argue that $4.5 comes first, $6 follows quickly and the fabled $10 print is finally “on the table” as the trifecta of cloud twist, time‑cycle symmetry and momentum converge. At press time, XRP traded at $3.55. -
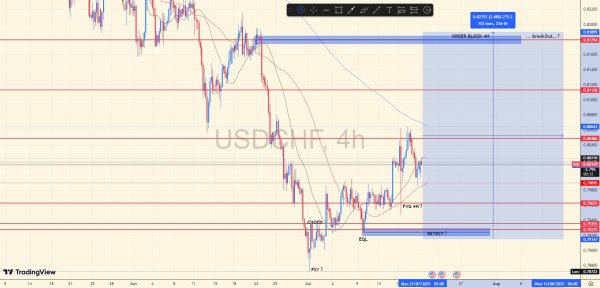 Perspectiva de análise RETEST em zona EQL após filtrar spring vermelho (FVG 4H), após 1 rejeição H1 (spring vermelho), é válido manter a RANGE dentro de EQL>ORDER BLOCK 4H para possível quebra de ORDERBLOCK 4H e breakOut de continuação. STOPLOSS não deve ser maior que o último spring vermelho PSY.
 -
The Final Bitcoin Act: Here’s What To Expect As BTC Trends Sideways
um tópico no fórum postou Redator Radar do Mercado
Bitcoin has already shown a lot of strength in recent times, pushing as high as $123,000 before trailing back down toward $117,000. So far, it looks like the digital asset has hit a roadblock and is now possibly looking at a peak. But analyst Merlijn The Trader has explained that it is far from over for Bitcoin with more rallies to come. He reveals that the Bitcoin price is yet to stage its ‘final act’, which must happen before there are talks of a top. Bitcoin 4-Year Cycle Is Still In Play After the Bitcoin price rallied to new all-time highs pre-halving, which had never happened before, there were talks that the 4-year cycle had been broken. For clarification, the 4-year cycle is tied to the Bitcoin halving events, which take place every four years, cutting block rewards for miners in half. However, the reduction in block rewards is not the only interesting thing about the 4-year cycle, because each halving also ushers in a new bull market. This has been the case for the past three bull cycles, and Bitcoin is also expected to follow this. Historically, the market rallies for around a year after the halving, with the top being reached one year later. Going by this trend, the Bitcoin price and the crypto market at large are expected to keep rallying before topping later this year. Pointing to this 4-year cycle, the analyst forecasts another stretch of price increases. The chart shows that price often declines for one year and then rallies for three years, and so far, the Bitcoin price has only been rallying for two, leaving 2025 as another year for rallying. Additionally, Bitcoin is still a long way from levels that have previously marked the top of previous bull markets. Thus, there is still a while before it hits its peak in 2025. Besides, each bull cycle has seen Bitcoin rise 3x higher than its previous all-time highs, and it is year to hit even 2x higher than its previous $69,000 high. How High Can BTC Go? If the 4-year cycle is still in play, then it means that the Bitcoin price rally is far from done. In the analyst’s chart, he shows the possible top for Bitcoin based on past cycles, and BTC is still in the middle of the box. The top of this box puts the BTC price at around $200,000 before a top can be reached. The analyst warns that Bitcoin is about to enter what he refers to as the “greenest stretch of them all”, pointing to another rally to all-time highs. If this forecast plays out, then Bitcoin is expected to see another 50% rally before the bull market is done. -
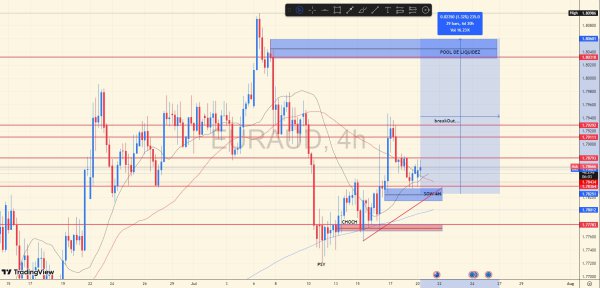 Perspectiva de análise Mais um teste na zona de SOW 4H, gerando rejeição e spring vermelho, em direção a zona a linha da última (HIGH HIGH), para testar o breakOut e seguir ao POOL DE LIQUIDEZ. Cautela: Pode criar uma acumulação entre SOW e breakOut até a quebra, gerenciamento parcial é fundamental. STOPLOSS não deve ser maior que o último spring vermelho abaixo do CHOCH (zona vermelha).
 -
 🔍 Bitcoin e assinatura pró-cripto de Trump gerou alertas entre analistas institucionais 📌 Preço Atual: US$ 118.530,30 📈 Variação no dia: +1,3% 📊 Tendência de curto prazo: Altista moderada com sinais de exaustão 🧠 Contexto e Narrativa do Mercado Nas últimas 24h, o Bitcoin operou com forte viés emocional e institucional, impulsionado pelas expectativas de assinatura de leis pró-cripto por Donald Trump, e uma narrativa de "adoção do blockchain como base dos pagamentos do futuro". A declaração do assessor Bessent, alinhado à administração Trump, de que “o dólar em breve estará no blockchain” reforçou o sentimento de otimismo. Contudo, a euforia gerou alertas entre analistas institucionais, que observam o risco de um movimento clássico de “buy the rumor, sell the news” — especialmente com o BTC tendo subido mais de 12% nas últimas semanas, em antecipação à assinatura da nova legislação. ⚠️ Possível “Armadilha de Alta” no BTC: Analistas alertam para o padrão informalmente apelidado de "накуканивание" (popularizado entre traders russos), que caracteriza: Compras eufóricas no topo; Venda silenciosa por grandes players; Distribuição de liquidez enquanto o varejo continua comprando; E eventual queda abrupta para liquidar posições superalavancadas. Com o BTC superando os US$ 118.000, esse padrão pode estar se formando, à medida que os volumes institucionais diminuem e a dominância emocional do varejo aumenta. 📉 Impacto Esperado com Assinatura do Projeto por Trump: Caso o presidente assine hoje a legislação cripto, o impacto pode variar conforme a reação dos players institucionais: Cenário Reação Esperada Impacto no BTC "Buy the rumor, sell the news" Lucros realizados imediatamente Queda rápida para a zona de US$ 113.000–114.000 Confirmação institucional (fundo soberano, ETF, bancos) Entrada de capital nova Abertura de alvo em US$ 123.000–125.000 Ambiguidade legal no texto Incerteza Volatilidade e lateralização entre US$ 115.000–119.000 📍 Pontos Técnicos de Interesse Resistência imediata: US$ 119.800 – último topo intradiário Zona crítica de distribuição: US$ 120.000–121.000 Suporte de curto prazo: US$ 116.700 (pivô intradiário) Zona de liquidez inferior (stop hunts possíveis): US$ 114.400–113.000 📊 Índice de Força Relativa (RSI): 72 — em zona de sobrecompra 💰 Open Interest (dados derivativos): em alta, com concentração em calls acima de US$ 120K 🧭 O Que Esperar? Nas próximas horas: A assinatura de Trump pode ser um gatilho imediato para realização de lucros; Se houver confirmação de suporte institucional adicional (ex: FED, Tesouro, JP Morgan) ao setor cripto, o BTC pode tentar romper a zona dos US$ 120.000; Caso contrário, pullback corretivo saudável para a faixa de US$ 114K–115K é provável antes de nova perna de alta. 📌 Resumo do Analista Igor Pereira – ExpertFX School
 -
🇺🇸 Trump Redefine o Significado de “Acordo Comercial”: Tarifas Agora São Consideradas Negociações Nas últimas semanas, Donald Trump e membros de sua administração vinham prometendo à imprensa uma série de grandes acordos comerciais com diversas nações. No entanto, em vez de anúncios formais de pactos comerciais, o que se materializou foi o envio massivo de cartas tarifárias com ameaças de aumento de tarifas de importação. Segundo fontes de Washington, mais de 25 países já receberam essas “cartas de tarifas” — com o conteúdo prevendo tarifas punitivas de até 35% ou 40% sobre bens importados para os EUA. Trump ainda afirmou que pretende expandir essa ofensiva, enviando cartas para mais de 150 países. 🧾 “Cartas de tarifas” agora são consideradas acordos Durante uma conferência recente, Trump foi ainda mais direto ao declarar: Na prática, Trump está redefinindo o conceito de acordo comercial: enviar uma ameaça tarifária já é, segundo ele, um acordo. O conteúdo da “negociação” seria a imposição unilateral de tarifas como forma de forçar concessões comerciais. 📌 O que esperar e qual o impacto no mercado? 1. Aumento de volatilidade nos mercados globais: As bolsas asiáticas e europeias já reagem com cautela à possibilidade de uma nova onda protecionista. Commodities como cobre e petróleo tendem a sofrer diante da perspectiva de desaceleração comercial. 2. Reprecificação de ativos de risco: A imposição de tarifas sobre uma gama mais ampla de países pode levar a uma revisão das projeções de crescimento global. Isso tende a beneficiar ativos de proteção como o ouro (XAU/USD) e o iene japonês (JPY). 3. Potencial resposta internacional: Países afetados podem retaliar, desencadeando novas disputas comerciais multilaterais, como ocorreu na guerra comercial EUA-China de 2018-2019. Isso pode afetar exportadores europeus, latino-americanos e asiáticos. 4. Pressão sobre cadeias globais de suprimento: Tarifas elevadas aumentam custos logísticos e reduzem margens industriais — o que impacta empresas listadas no S&P 500, especialmente nos setores de tecnologia, automotivo e manufatura pesada. 🎯 Conclusão Analítica – Por Igor Pereira A nova abordagem de Trump é claramente coercitiva e voltada a maximizar concessões via pressão tarifária, não via diplomacia multilateral. Essa postura pode agradar setores industriais dos EUA no curto prazo, mas gera incertezas macroeconômicas relevantes para o médio e longo prazo. O mercado deve se preparar para um aumento na aversão ao risco, com potencial valorização do ouro (XAU/USD), do dólar americano (DXY) frente a moedas emergentes, e queda de ativos cíclicos e sensíveis a exportações. 📊 Acompanhe o fluxo institucional no ouro e os próximos pronunciamentos oficiais de Trump para avaliar pontos de entrada em ativos de proteção.
-
OURO (XAU/USD): Viés Altista Intacto, Mas Tensões Surpreende
um tópico no fórum postou Igor Pereira Sentimento de Mercado
📈 OURO (XAU/USD): Viés Altista Intacto, Mas Tensões Surpreende Por Igor Pereira – Analista de Mercado Financeiro | Membro WallStreet NYSE 🧭 Cenário Geral e Impactos Recentes O ouro (XAU/USD) permanece com viés altista mesmo diante de um ambiente de incertezas quanto à trajetória dos juros norte-americanos, fortalecimento do dólar e riscos geopolíticos crescentes. O metal subiu 0,17% nesta segunda-feira, sendo cotado a US$ 3.350,10, com a realização parcial de lucros após forte demanda por proteção nas últimas sessões. Apesar da retração intradiária, o ouro se mantém bem apoiado pela combinação de ameaças tarifárias, inflação resiliente e preocupações com a independência do Federal Reserve, todos fatores que sustentam sua atratividade como ativo de refúgio institucional. 🏴☠️ Fundamentos em Destaque Tensões Comerciais em Alta: O presidente Donald Trump confirmou tarifas de 30% sobre importações da União Europeia e México a partir de 1º de agosto, reacendendo receios de uma guerra comercial global. A medida provocou inicialmente uma onda de compras em ouro, mas o fôlego perdeu força após a UE adiar sua retaliação. Inflação Surpreende em Alta: O índice CPI de junho nos EUA avançou para 2,7% ao ano, complicando o cenário para cortes de juros. A inflação elevada alimentada por tarifas pode restringir a margem de manobra do Fed. Expectativas de Cortes em Queda: Apesar do tom dovish do governador Waller, os fortes dados de vendas no varejo e a queda nos pedidos de auxílio-desemprego reduziram as apostas de cortes de juros para 45bps até o fim de 2025, contra 50bps anteriormente. Dólar em Alta Pressiona Commodities: O Dollar Index (DXY) subiu 0,61%, tornando o ouro mais caro em outras moedas, o que pressiona sua cotação no curto prazo. Contudo, temores quanto à independência do Fed e a possibilidade de renúncia de Jerome Powell (conforme rumores recentes) mantêm suporte estrutural ao ouro. 🔍 Análise Técnica – XAU/USD O gráfico diário do ouro permanece com viés comprador (bullish bias) em contexto de “buy-the-dip”, onde recuos são vistos como oportunidades de entrada por grandes players institucionais. 📌 Níveis Técnicos Importantes: Resistência (UTAD) chave: $3.451,53 — o rompimento desse nível pode confirmar nova perna de alta com alvo em $3.518 e, posteriormente, $3.600. Suportes (Break Of Structure, BOS) relevantes: $3.310,48 (nível de pivô semanal) $3.244,41 (suporte estrutural e fundo recente) Chave: Enquanto o preço se mantiver acima de $3.310, o ouro continua operando em estrutura técnica favorável a compras, mesmo em meio a realizações de curto prazo. 📊 Expectativas para o Mercado O que esperar: Novas falas de Powell nesta terça-feira podem ser decisivas. Rumores indicam forte pressão da equipe de Trump para que o presidente do Fed renuncie, em meio à resistência em acelerar cortes de juros. Caso confirmada a renúncia, o impacto pode ser explosivo nos mercados, impulsionando ouro, treasuries longos e ativos defensivos, enquanto o dólar pode perder força temporariamente. Impacto no mercado financeiro: Caso o Fed seja percebido como politizado, a confiança institucional no dólar pode enfraquecer, ampliando a busca por proteção via ouro físico, ETFs e contratos futuros. Novas medidas retaliatórias da Europa ou México também podem elevar a volatilidade e sustentar o ouro acima dos $3.350. 🧠 Conclusão do Analista Igor Pereira O cenário para o ouro segue tecnicamente robusto, mesmo com oscilações táticas. O nível de $3.451 é o mais importante do momento, com potencial para liberar forte fluxo comprador caso rompido com volume. Enquanto isso, qualquer movimento abaixo de $3.310 ainda representa oportunidade de entrada estratégica, considerando a deterioração da estabilidade política nos EUA e o ambiente de juros real persistentemente negativo. No Clube ExpertFX atualizamos diariamente os níveis técnicos e análises detalhadas sobre XAU/USD. -
RUMORES SOBRE POWELL PODEM ABALAR OS MERCADOS
um tópico no fórum postou Igor Pereira Sentimento de Mercado
🚨 URGENTE: RUMORES SOBRE POWELL PODEM ABALAR OS MERCADOS (Análise Técnica e Fundamentalista – ExpertFX School) 🗞️ Resumo da Informação Segundo rumores que circulam nos bastidores de Washington e de fontes ligadas à administração Trump, o presidente do Federal Reserve, Jerome Powell, estaria sofrendo forte pressão do governo para reduzir as taxas de juros imediatamente. Relatos indicam que Powell pode anunciar sua renúncia já na próxima terça-feira, durante seu discurso programado. A recusa em cortar os juros teria motivado o impasse com a Casa Branca. 📊 O Que Isso Significa para o Mercado? 🔻Powell irá renunciar: Alta volatilidade nos mercados de renda variável e Forex; Rali especulativo no ouro (XAU/USD) como ativo de proteção; Dólar (DXY) pode sofrer liquidação inicial, mas com possível recuperação dependendo do sucessor; Criptomoedas podem se beneficiar temporariamente com a aversão ao risco institucional. 🏛️ Contexto Político: A administração Trump tem defendido abertamente uma política monetária mais expansionista, com foco em impulsionar os mercados e a economia no curto prazo. O Fed, por sua vez, tem adotado uma postura mais cautelosa frente aos sinais persistentes de inflação e superaquecimento em setores estratégicos. 🔮 Expectativas do Mercado: Caso o rumor se confirme na terça-feira, espera-se um aumento abrupto na demanda por ativos defensivos e um ambiente de incerteza institucional. Trechos do discurso de Powell devem ser analisados em tempo real por analistas e algoritmos institucionais. Um sucessor mais alinhado com Trump pode levar a cortes agressivos nas taxas ainda em 2025, o que traria impacto direto sobre Treasuries, commodities e ações de tecnologia. 🟡 Impacto no ouro (XAU/USD): Rompimento de resistências técnicas pode ocorrer em caso de renúncia, especialmente se o mercado antecipar um Fed mais dovish. Atenção especial à zona dos $3.275 – $3.290, com potencial para breakout até $2.420–$2.450. O ouro se fortalece como ativo de confiança em cenários de instabilidade institucional. 💬 Comentário do Analista Igor Pereira – ExpertFX School 📌 O que monitorar: Discurso de Powell na terça-feira (horário a confirmar); Reação imediata do mercado futuro de juros e swaps; Comportamento do índice do dólar (DXY), ouro e S&P 500; Posicionamento de ETFs institucionais. Deseja receber a análise completa dos níveis técnicos em XAU/USD e os possíveis cenários após o discurso de Powell? 👉 Entre para o Clube ExpertFX e receba nossos relatórios Premium. 📊 Análise técnica + leitura institucional por Igor Pereira, Membro WallStreet NYSE. -
🌍 GUERRA COMERCIAL EUA x EUROPA — Europa deve evitar retaliações contra os EUA, diz Secretário de Comércio O Secretário de Comércio dos Estados Unidos, Daniel Lattnik, afirmou neste domingo (20) que não acredita que a União Europeia adotará medidas de retaliação contra os produtos americanos, mesmo após o prazo de 1º de agosto, quando entra em vigor o novo pacote tarifário imposto por Washington. 📦 Contexto: Tarifas e tensões comerciais Desde que os EUA anunciaram novas tarifas sobre veículos elétricos, aço e produtos agrícolas europeus, aumentaram os temores de uma escalada protecionista entre as duas potências econômicas. Bruxelas prometeu “avaliar medidas apropriadas”, mas ainda não apresentou uma resposta concreta. Nos bastidores, diplomatas europeus demonstram preocupação com os efeitos econômicos de um confronto comercial direto, principalmente em um momento de desaceleração na indústria da Zona do Euro e incertezas geopolíticas globais. 📉 Impacto no mercado financeiro 1. Dólar Americano (DXY): O índice DXY renovou máximas nesta segunda-feira, atingindo o maior patamar desde 23 de junho, impulsionado pela percepção de força econômica dos EUA e menor risco imediato de retaliação comercial. 2. Ouro (XAU/USD): A ausência de retaliações pode gerar alívio nos mercados de risco, o que tende a reduzir temporariamente a demanda por ouro como proteção, especialmente após a forte valorização das últimas semanas. 3. Ações europeias: O euro e os índices acionários europeus podem reagir positivamente à ausência de resposta agressiva por parte da UE, embora o setor automobilístico continue vulnerável. 🔍 O que esperar? Curtíssimo prazo: Diminuição da aversão ao risco e impulso ao dólar, com possível correção no ouro. Médio prazo: Caso a União Europeia opte por não retaliar, isso pode ser lido como sinal de fraqueza diplomática, especialmente diante de um governo Trump mais agressivo no comércio internacional. Atenção do mercado: Continuidade das falas de autoridades europeias nesta semana. Qualquer indicativo de retaliação ainda pode mudar o cenário abruptamente. 🧠 Análise do analista Igor Pereira – ExpertFX School A fala do secretário Lattnik busca gerar estabilidade em um momento de tensão política entre Washington e Bruxelas. No entanto, a ausência de retaliação pode refletir o temor europeu de agravar a recessão industrial já em curso. Para o trader institucional, o foco deve estar em pares como EUR/USD, que pode seguir pressionado, e no XAU/USD, que pode corrigir antes de retomar tendência altista.
-
House Passes Major Bills During ‘Crypto Week,’ But Significant Changes May Take Time
um tópico no fórum postou Redator Radar do Mercado
Despite the excitement surrounding what President Donald Trump has dubbed “Crypto Week,” experts caution against premature celebrations in the cryptocurrency space. The House of Representatives recently passed three significant bills aimed at regulating digital assets, marking a pivotal moment for the industry. However, these legislative changes are not expected to take effect for quite some time. Three Key Crypto Bills Passed The three bills—the Genius Act, the Digital Asset Market Clarity Act, and the Anti-CBDC Surveillance State Act—are seen as crucial steps toward establishing a regulatory framework for cryptocurrencies. This development has been fueled by intense lobbying efforts from industry players like Coinbase Global, which have successfully influenced politicians, including Trump. In anticipation of this legislative week, Bitcoin prices soared to record highs beyond the $123,000 mark for the first time, alongside significant gains for other cryptocurrencies like Ethereum (ETH) and XRP. However, TD Securities analyst Jaret Seiberg notes that it could take over a year for the new legislation to come into effect. Among the passed bills, only the Genius Act has also cleared the Senate, and Trump signed it into law shortly thereafter. This act establishes a framework for regulating payment stablecoins requiring issuers to maintain one-to-one reserves in US dollars or Treasury securities. Treasury Secretary Scott Bessent has argued that this law could generate an additional $3.7 trillion demand for T-bills, although some analysts, like Raymond James’ Ed Mills, express skepticism about such projections. Implementation Timeline Remains Uncertain Despite the signing of the Genius Act, there will be no immediate impacts on stablecoin issuers such as Circle Internet Group or Tether. As reported by ABC news, the Treasury Department is expected to draft rules within a year detailing the qualifications for issuing stablecoins and the conditions under which foreign-pegged stablecoins can enter the US market. This process will involve public commentary and could lead to litigation, suggesting a lengthy timeline before any real changes are felt in the industry. The Digital Asset Market Clarity Act, on the other hand, is particularly important as it delineates the regulatory oversight of crypto exchanges, brokers, and tokens between the Commodity Futures Trading Commission (CFTC) and the Securities and Exchange Commission (SEC). With bipartisan support in the House, there is optimism that the Senate will pass its version before the upcoming August recess, potentially delivering a unified law for the president’s signature by September. The Anti-CBDC Surveillance State Act, the third piece of legislation, aims to prevent the Federal Reserve from issuing a central bank digital currency (CBDC). This bill, which passed with narrower margins, was attached to a national defense bill, and its future in the Senate will likely involve protracted negotiations, possibly extending until December. Featured image from DALL-E, chart from TradingView.com - Yesterday
-
Litecoin Price Crosses $110 Level After 20% Rally — What’s Next For LTC?
um tópico no fórum postou Redator Radar do Mercado
The Litecoin price has been on an impressive run over the last few weeks, mirroring the improving climate of the altcoin market in that period. In the past week, the LTC token put out a strong bullish display, returning above the psychological $100 mark for the first time since mid-May. The Litecoin price has not stopped at the breach of the $100 level, climbing above the $110 mark on Saturday, July 19, to cap off an exhilarating week. Interestingly, the price of LTC seems to only be at the beginning of an extended rally, as pointed out on X by an expert crypto trader. Is LTC About To Witness A 900% Surge? In a recent post on the X platform, Chartered Market Technician (CMT) Tony Severino painted an excitingly bullish picture for the Litecoin price even after its recent market exploits. According to the crypto expert, the price of LTC is on the verge of a bullish breakout that could decide its trajectory over the next few months. This bullish projection is based on a multi-year contracting (or symmetrical) triangle pattern on the Litecoin 2-week chart. The contracting triangle is a pattern in technical price analysis marked by a falling upper boundary (connecting a series of lower highs) and a rising lower trendline (connecting a series of higher lows). In a symmetrical triangle pattern, the asset price continuously contracts and moves toward the apex. Eventually, the price will breach the upper trendline for a breakout or breach the lower trendline for a breakdown. This chart formation could be a continuation or reversal pattern depending on the break’s direction (breakout or breakdown) and the initial trend direction. However, symmetrical triangles are often continuation patterns, meaning the price tends to break in the initial trend direction before it fell into the triangle pattern. So, if history is anything to go by, the Litecoin price is likely to continue its upward trend after it breaks out of the current setup. As Severino pointed out, the Litecoin price is preparing to break out of this multi-year symmetrical triangle and could be on track to break above its current all-time high of $410. In a contracting triangle formation, the price target is determined by adding the length of the widest point of the triangle (or base) to the breakout point. Going by this logic, the price of Litecoin could be on the verge of an over 900% surge over the next few months. Litecoin Price At A Glance As of this writing, the price of LTC sits at around $112.5, reflecting a nearly 11% gain in the past 24 hours. -
Tezos Crypto: The Latest Dinosaur Coin To Pump After XRP Hits New All-Time High
um tópico no fórum postou Redator Radar do Mercado
Historically, one indicator of an upcoming bull run is when “dino” coins start to surge in value. Recently, XRP has led the way, reaching a new all-time high (ATH) of $3.65 on July 16. Now, Tezos has emerged as the latest OG dino coin to make waves, experiencing an increase of over 55% in just 24 hours. While ETH continues to inch slowly upward toward $4,000 and Bitcoin sits comfortably under $120,000 following its significant run, OG coins such as Ripple (XRP), Tezos (XTZ), and Litecoin (LTC) are all making big moves. (SOURCE) XTZ Surges Back Over $1 As Tezos Crypto Is The Latest OG Coin To Pump Tezos crypto, a token that has been around since 2018, experienced an overnight surge, with a +40% pump that has taken the OG coin back over $1 for only the second time this year. It is an often-forgotten OG cryptocurrency, a Layer-1 protocol that was once a top 10 token by market cap, back in February 2020. At that time, there were significantly fewer digital assets on the market, and XTZ was a relatively new and hyped project. Remarkably, the daily trading volume for XTZ has exceeded $1.2 billion, equalling the Tezos cryptocurrency market cap, highlighting the demand for OG coins at present. Even with its latest price increase, Tezos crypto is now only the 101st largest token by market capitalization, a significant decline from its once prominent position among the likes of Bitcoin, Ethereum, Litecoin, and EOS. In reclaiming $1, XTZ has also reclaimed its coveted $1 billion market cap status, and any further move from here will likely place it back into the top 100 cryptocurrencies. Tezos crypto is currently facing significant resistance between $1.15 and $1.20; however, if it manages to break through this level, it could easily rally towards $3. Due to its longevity and time at the top, XTZ is available on all major exchanges, including Binance, Coinbase, OXK, ByBit, and many more. It is a contributing factor to the 800% increase in trading volume experienced by Tezos, as it is widely available on exchanges worldwide. DISCOVER: Top 20 Crypto to Buy in July 2025 Dinosaur Coins Pumping Across The Board As LTC And XRP Also Hit New Heights Over the years, Ripple has continued to develop its platform and attract new investments. The latest fuel for the XRP moon mission is its RLUSD stablecoin, a USD-backed stablecoin that has amassed a $500 million market cap since its launch in December 2024. This growth is expected to lead to the potential listing of an XRP exchange-traded fund (ETF) later this year. Bloomberg analysts estimate a 90% chance that an XRP ETF will be approved in 2025. All of Ripple’s growth over the past year has been driven by a settlement of the longstanding legal dispute between XRP and the US Securities and Exchange Commission (SEC). Official confirmation is expected to be made later this month, which should finally resolve the nearly five-year case between Ripple and the SEC. EXPLORE: 10 Best AI Crypto Coins to Invest in 2025 Join The 99Bitcoins News Discord Here For The Latest Market Updates The post Tezos Crypto: The Latest Dinosaur Coin To Pump After XRP Hits New All-Time High appeared first on 99Bitcoins. -
Bitcoin Won’t Save You—Peter Schiff Says Gold Will Win As Trump Wrecks The Dollar
um tópico no fórum postou Redator Radar do Mercado
Gold proponent Peter Schiff hit out at US President Donald Trump’s support for cryptocurrency, calling Bitcoin a “decentralized Ponzi scheme” wrapped in the American flag. He warned that pushing digital assets at home could erode trust in the dollar. Schiff said that, while some may cheer weaker paper money, it will be gold that wins when Bitcoin finally stumbles. Dollar Confidence In Question According To Schiff, encouraging domestic investment in Bitcoin and crypto “undermines the US economy and speeds up the dollar’s collapse.” He argued that millions of Americans buying digital tokens won’t prop up the world’s main reserve currency. Schiff believes real damage comes when retail investors swap dollars for speculative coins, tipping the scales against greenbacks in global markets. Ponzi Scheme Allegations Schiff described recent cryptocurrency bills as little more than a way to “cloak Bitcoin—nothing more than a decentralized Ponzi scheme—in the trappings of legitimacy.” He claimed insiders use new laws to drive prices up, then get out at higher levels. “The industry is using them to hype Bitcoin and other cryptos so insiders can cash out at higher prices. It’s a legislative low point,” he wrote on X. Stablecoins Under Scrutiny Based on reports, Schiff sees stablecoin plans as a false promise for dollar dominance. He pointed out that a stablecoin backed by any fiat currency offers no real edge. That stability, he warned, will soon give way. He also pointed out tht dollar‑backed coins are only as stable as the underlying money. Echoes Of Tulip Mania Invoking Charles Mackay’s 1630s tale, Schiff compared the digital token craze to the Dutch tulip bubble. He quoted Mackay: “They go mad in herds, and only recover their senses slowly, and one by one.” In that era, bulb prices soared before crashing overnight. Schiff said swapping tulips for Bitcoin makes the same point. Gold Set To Benefit Schiff predicted that, even if Bitcoin supporters toast short‑term dollar weakness, gold will be the real winner. He said that shaky digital schemes will collapse at some point, just as tulip contracts became worthless. When that happens, he expects gold prices to climb. Featured image from Pexels, chart from TradingView -
Gold price to hit $3,600 this year and next: CIBC
um tópico no fórum postou Redator Radar do Mercado
Despite gold’s recent slump, CIBC Capital Markets still expects the yellow metal to reach new heights this year, with prices averaging $3,600 per ounce in the second half. Behind the bullish forecast is “a banquet of uncertainty around the world” boosting the appeal of alternative reserve assets, according to analysts led by Anita Soni. Amongst the key drivers cited by Soni’s team are expectations for lower interest rates, geopolitical uncertainty and continued stockpiling by central banks. “We continue to expect a positive macroeconomic setup for gold,” Soni wrote in a report last week. “We believe [US] rate cuts are likely and it’s a matter of ‘when and how fast’, and not ‘if.’” “Geopolitical tensions in the Middle East and Russia remain elevated,” she added. “All this uncertainty has led to the acceleration of de-dollarization, supporting gold prices.” Further upside Gold, seen as the ultimate safe-haven asset during uncertain times, has climbed by nearly 30% this year amid rising global trade tensions. In April, the metal soared to a record of $3,500 per ounce. CIBC’s gold forecast would represent another 3% upside to the all-time peak. In December 2024, the team led by Soni predicted prices to average $2,800 this year, which has been easily surpassed. Click on chart for Live Prices Moreover, Soni expects the $3,600 average gold price forecast to remain through next year, before pulling back to around $3,300 in 2027 and $3,000 in 2028. With a fresh gold outlook, the CIBC analysts also boosted their price targets for a basket of Canadian gold mining stocks, including Agnico Eagle Mines (TSX: AEM), Kinross Gold (TSX: K), Alamos Gold (TSX: AGI), Franco-Nevada (TSX: FNV) and Discovery Silver (TSX: DSV). -
Dogecoin Whale Bets $21 Million After $2.14M Profit – What’s Going On?
um tópico no fórum postou Redator Radar do Mercado
A major Dogecoin whale is making a bold $21.24 million leveraged bet just days after locking in a multi-million-dollar profit. The move, which was revealed by Lookonchain, sparked interest among crypto investors on the social media platform X. This comes as Dogecoin is starting to deviate from its bearish Q3 history with a strong performance in the past seven days. Whale Makes High-Stakes On Dogecoin According to on-chain transaction monitor Lookonchain, a crypto whale identified as address 0x6adb recently closed a previous long position on Dogecoin with a tidy $2.14 million profit. According to data from HyperDash, this position was open for 63 hours and was eventually closed on July 18. The entry was spot on, and the position was able to take full advantage of Dogecoin’s push from $0.19 to $0.24 within this time period. However, what makes this trade notable isn’t just the size of the gain but the fact that the whale immediately re-entered the market with even more confidence. A few hours after exiting, the whale opened a new 10x leveraged long position on 84.08 million DOGE, which was worth approximately $21.24 million at the time. Interestingly, the new long position was timed nearly perfectly again. As noted by Lookonchain, the position quickly moved in the whale’s favor, racking up an unrealized profit of $1.64 million. Dogecoin Enters Q3 With 53% Gain Dogecoin’s strong performance in July has marked a positive start for its price action in Q3 2025. Interestingly, the last time Dogecoin ended Q3 with a positive close was in 2020. Since then, the memecoin has posted Q3 losses for six consecutive years, ranging from 6.9% in 2023 to as high as 18% in 2021. However, as it stands, data from CryptoRank shows that Dogecoin is now experiencing a 53.6% increase in Q3 2025. At the time of writing, Dogecoin is trading at $0.253, marking a 28% increase from $0.197 just a week ago. According to CoinGlass data, Dogecoin’s open interest on the derivatives market has crossed over the $4 billion mark for the first time since February. This data shows that there are a large number of active participants and strong interest in Dogecoin, which is a positive outlook for its price action in the new week. The $0.25 price level is now a support zone and Dogecoin could embark on a strong move to $0.30 and beyond in the new week if this floor holds. However, any decisive drop below it will flip sentiment fast. For a trader with a 10x long position, even a 10% dip in Dogecoin’s price will push the trade deep into negative territory. The whale’s position could be liquidated or severely impacted if Dogecoin retraces to earlier support levels around $0.22 or lower. Featured image from Unsplash, chart from TradingView -
Warning Signs Flash As Bitcoin Miners Unload At Record Pace
um tópico no fórum postou Redator Radar do Mercado
Bitcoin’s run above $120,000 has drawn fresh selling from the very people who dug it up. On July 15, miners sent a hefty 16,000 Bitcoin to exchanges—the most in a single day since April—raising questions about how long the rally can keep climbing. According to CryptoQuant data, those daily outflows edged past the earlier high, signaling that miners are cashing in on recent gains. That kind of supply surge can weigh on prices, at least for a little while. Miner Sales Hit Yearly High Based on reports from CryptoQuant, the jump to 16K BTC occurred as miners sensed a chance to lock in profits after Bitcoin’s latest spike. Earlier this year, on the way up from $75K to just over $100K, miners offloaded roughly 17K BTC in April alone. Now, with prices pressing past $120K, they’re back at it. Miners often sell when their hardware costs are covered and they stand to pocket hefty gains, but when they all sell at once, it can tip the market into choppy waters. Mid-Range Holders Offload 3K BTC Big miners aren’t the only ones stepping to the exits. Wallets holding between 100 and 1,000 BTC cut their balances from 68K BTC to 65K BTC since mid‑June—about 3K BTC shed in just a few weeks. During the April rally, that same group sold close to 5K BTC before shifting back into buy mode when prices settled into a range. Now, they’re a key source of extra supply as the latest breakout attracts their attention. Exchange Inflows Can’t Keep Up At the same time, the total amount of crypto sent to exchanges shot up from around 13K BTC per day to about 58K BTC this week. That four‑fold rise shows profit‑takers rushing to offload coins. Bitcoin At $118K At the time of writing, Bitcoin was trading at $118,000, still down 0.3% in the last 24 hours, CoinMarketCap data shows. -
Bitcoin Re-Enters Profit Zone As Greed Rises, But Rally To $200,000 Still Possible
um tópico no fórum postou Redator Radar do Mercado
Bitcoin reached a new all-time high of $122,838 on July 14, but has since slipped into a phase of consolidation around the $118,000 level. The recent pause in upward momentum hasn’t dampened market sentiment, which remains firmly bullish. According to Coinmarketcap’s Fear & Greed Index, Bitcoin is still currently sitting at a greed level of 68. This sentiment, combined with technical analysis of the Logarithmic Growth Curve (LGC), shows that Bitcoin is still on track for powerful upward moves. Greed Returns To The Market, But Not Yet Overheated Bitcoin’s price action has spent the majority of the past 48 hours holding above $118,000 after a wave of profit-taking took place just after it peaked at $122,838. However, on-chain data shows an interesting overview of Bitcoin investors. Particularly, crypto analyst Axel Adler Jr. shared data from CryptoQuant showing that the 30-day moving average of the Fear and Greed Index has climbed back into the optimism zone, now sitting at 66.2%. Although sentiment surrounding the leading cryptocurrency is currently in greedy territory, this level is well below the 75% to 80% range, which coincided with new price highs in March 2024 and December 2025 The current 66% reading, while in the green level, suggests there’s still room for bullish sentiment to grow before the market enters a euphoric blow-off phase. In essence, this metric shows that if Bitcoin continues to consolidate and push higher without the sentiment entering into extreme greed levels between 75% and 80%, it will continue on a sustainable push to new heights. Image From X: @AxelAdlerJr Bitcoin Re-Enters Resistance Zone On Growth Curve As mentioned earlier, Bitcoin’s break above the $120,000 price level and its subsequent peak were followed by a wave of profit-taking. The trend saw Bitcoin’s price correct to $116,000 very briefly before stabilizing around $118,000. Interestingly, technical analysis of the weekly candlestick timeframe shows that Bitcoin re-entered the first band of the Logarithmic Growth Curve (LGC) resistance zone as it reached this price peak. This band, which is identified as the light pink region in the chart below, has always served as the profit-taking area in each of Bitcoin’s past bull markets. Interestingly, Bitcoin briefly tapped this area in December 2024 and January 2025 before being rejected, in a pattern similar to that of January 2021’s first top in the previous bull cycle. Image From TradingView: TradingShot Basically, this indicator implies that Bitcoin is now at the start of a final build-up phase. According to crypto analyst TradingShot, who posted the analysis on the TradingView platform, the ultimate top for this cycle is going to be between October and November 2025. Depending on the timing and strength of factors like anticipated US rate cuts in September, Bitcoin’s peak could land anywhere between $140,000 and $200,000. At the time of writing, Bitcoin is trading at $118,152. Featured image from Pexels, chart from TradingView -
Ethereum Set To Hit $10,000, Elliott Wave Analysis Predicts
um tópico no fórum postou Redator Radar do Mercado
Over the past week, the Ethereum (ETH) market recorded a solid positive price performance, reaching as high as $3,600. Notably, the second-largest cryptocurrency, among many altcoins, is experiencing a strong bullish momentum as evidenced by price gains of 45.48% over the last month. Amid the present market euphoria, Dutch market analyst Gert Van Lagen has backed Ethereum’s chances for sustained price gain based on an Elliott wave analysis. Ethereum To Complete Bull Market Cycle On High Note – Analyst The Elliot wave theory is a technical framework used to predict price targets by identifying repetitive patterns in price movements driven by investor psychology. In an X post on July 18, Van Lagen explains that this price forecast framework indicates that Ethereum may be entering the final phase of its bull market cycle, with a potential price target of $10,000. According to the analyst, the ETH bi-weekly trading chart suggests the cryptocurrency is completing a textbook five-wave cycle that began in 2022, with the fifth and final wave now unfolding in the form of an expanding diagonal. For context, the Elliot wave theory identifies a single price cycle in five waves, each composed of subwaves abc. As seen in the chart above, this includes the wave I marked by an initial impulse rally, followed by a sharp corrective Wave II as seen between 2022 and 2023. Wave III is defined by explosive momentum, pushing Ethereum to new highs, before entering a lengthy Wave IV consolidation characterized by a flat correction. Finally, there is wave V, i.e., the current status of the market, which is usually a final price surge. After breaking out of the upper boundary of the Wave 3–4, Gert Lagen explains that Ethereum is about completing subwave a of wave V following its most recent price gains. Therefore, investors should expect a brief pullback to retest the breakout zone, which would complete subwave ‘b’. After that, a blow-off rally forming subwave ‘c’ is on the cards, i.e., a price move that could push Ethereum to the $10,000 mark based on a broader Elliott wave analysis on the Ethereum bull market stretching from 2019 to date. Ethereum Price Overview At press time, Ethereum is trading at $3,657, posting gains of 1.79% over the past 24 hours and 21.8% over the last seven days. However, daily trading volume has dropped by 46.03%, signaling a potential weakening in the bullish momentum behind the current price surge. Following its most recent gain, the altcoin continues to retain its position as the second-largest cryptocurrency with a market cap of $441.14 billion and 11.1% market share. -
Ethereum Binance Reserves At New High As Dominance Grows — What This Means For Price
um tópico no fórum postou Redator Radar do Mercado
Ethereum has revived a long-lost faith in its investors following its recent impressive price action, which saw the altcoin reclaim the $3,000 level. While the ETH token is still a fair distance from its all-time-high price, the “king of altcoins” has started to reclaim its somewhat lost reputation in the crypto market. While the Ethereum price has somewhat slowed this weekend, the second-largest cryptocurrency has managed to hang around the $3,600 level. However, the latest on-chain data has cast doubt on the capacity of the ETH token to continue its bullish rally in the coming days. Ethereum’s Binance Reserve Hits New High In a Quicktake post on the CryptoQuant platform, CryptoOnchain revealed that Ethereum recently hit its highest reserve level on the world’s largest cryptocurrency exchange by trading volume, Binance. This on-chain observation was based on the Exchange Reserve metric, which measures the total amount of Ether tokens being held in wallets on a crypto exchange (Binance, in this case) at a given time. It also gives an insight into the netflow into these Binance wallets. When inflows overshadow the outflows, the Binance Ethereum reserve increases, meaning there is more ETH token on the exchange. On the other hand, more outflows compared to the inflows means the exchange reserve decreases. According to the analyst, the last time the Binance Ethereum reserves hit a new high was in November 2022. This latest occurrence indicates increased strength in exchange activity over the past weeks. CryptoOnchain further explained that while this increased activity might mean potential selling pressure for the cryptocurrency, the context suggests that the opposite is the case. With the Ethereum price experiencing its bullish rally, this growth in market participation could be a result of renewed bullish sentiment. ETH Dominance Regains Lost Ground CryptoOnchain also reported that Ethereum’s dominance is reaching levels it had previously lost in its periods of poor performance. The relevant on-chain indicator here is the Market Cap ETH Dominance, which measures the percentage of Ethereum’s market capitalization compared to other cryptocurrencies’ market capitalization. This indicates Ethereum’s share in the overall crypto market, and is usually represented in a Renko chart. The Renko chart shared by the analyst reflects a “strong bounce” from the critical 8% support zone, as it heads towards 11.2%. The online pundit further explained that with a notable divergence seen on the Moving Average Convergence Divergence (MACD), this strength could mean growing Ethereum leadership as Bitcoin’s momentum cools. CryptoOnchain, however, expects this growing dominance to face resistance around the 14% level. If Ethereum’s dominance holds, and its price manages to stay above $3,500, there might be further upside movement. The analyst, however, preached caution in market involvement as Ethereum approaches the aforementioned resistance, which might cause possible short-term corrections. As of this writing, Ethereum is valued at about $3,655, reflecting a 1.5% increase in the past 24 hours. -
Recent developments paint a complex picture of crypto in Asia, where, on one hand, established firms are doubling down on regulated digital assets, while law enforcement agencies grapple with surging wrench attacks and criminal misuse of cryptocurrencies. Metaplanet Acquired South Korea’s SGA To Strengthen Its Bitcoin Strategy The Japanese Bitcoin Treasury firm, Metaplanet, has acquired a controlling stake in the South Korean publicly listed software company, SGA. If finalised, SGA would be able to acquire Bitcoins as part of a broader digital strategy. According to an article published on 15 July 2025, the company’s CEO, Simon Gerovich, entered into a consortium with Hong Kong-based Moon Inc., Bangkok’s Kliff Capital, Taipei’s crypto-focused venture capital firm, Sora Ventures and UTXO Management, a Bitcoin-focused investment and advisory firm, to advance its Bitcoin accumulation campaign in Asia. The move reflects an industry trend of a broader adoption of digital assets by established financial firms, bridging traditional finance with digital assets. Since regulated crypto investment options in Asia remain limited, the VCIG Bitcoin Fund aims to improve the region’s crypto infrastructure. The fund aims to boost liquidity, enhance custody solutions, and attract participation from a wider array of family-run offices and institutional asset managers. Explore: 20+ Next Crypto to Explode in 2025 Key Takeaways Metaplanet entered into a consortium with Moon Inc., Kliff Capita, Sora Ventures and UTXO Management to further its Bitcoin accumulation strategy in Asia Wrench attacks have doubled in the APAC region compared to 2021 figures, with 35 cases reported so far India’s FIU is probing Binance regarding suspicious cross-border crypto transfers to private wallets VCI Global launched the VCIG Bitcoin Fund to offer investment options to institutional and high-net-worth investors in Asia The post This Week In Crypto Asia: Metaplanet Bets On South Korea, Binance Cooperates With India’s FIU appeared first on 99Bitcoins.
-
Africa crypto news: Kenya is considering the “Travel Rule” in VASP as Sui Foundation launches a blockchain hub in Nigeria. MoneyBadger of South Africa raises $400,000. The Sui Foundation has launched a blockchain hub in Nigeria to boost the country’s developer ecosystem. In South Africa, the crypto startup Moneybadger has raised $400,000 in its pre-seed round to boost Bitcoin payments. Meanwhile, in Kenya, the government is seeking to implement the “Travel Rule” in the recently proposed VASP bill. These, and more stories, make the continental headlines for the week: Nigeria Crypto News: Sui Foundation Launches Blockchain Hub in Lagos Sui Foundation, which is behind SUI, is investing in a blockchain hub in Nigeria to grow the country’s developer ecosystem. This launch extends Sui Foundation’s grassroots outreach effort in the African and Asian markets. South Africa boasts one of the most impressive crypto payment adoption rates, and this platform aims to leverage this growing market to become an industry leader. DISCOVER: The 12+ Hottest Crypto Presales to Buy Right Now Kenya Crypto News: Legislation To Introduce ‘Travel Rule’ The Government of Kenya is considering introducing the “Travel Rule” Virtual Assets Providers (VASP) Bill, which continues to take shape. This rule requires crypto service providers to collect and share information, including transaction history and physical addresses, with other service providers and financial institutions with which they engage. This requirement is an effort to comply with international requirements by the Financial Action Task Force (FATF) and related global regulators. Crypto regulations will always be a delicate balancing act. This is because the initial premise of crypto, even the best new cryptos to invest in, was to offer an alternative to mainstream finance. That said, crypto service providers operate in a reality where they need to create working relationships with local governments. As such, Kenyan operators could soon face this reckoning. DISCOVER: Next 1000x Crypto – 12 Coins That Could 1000x in 2025 Africa Crypto News: Kenya Travel Rule, Sui In Nigeria Nigeria Crypto News: Sui Foundation launches blockchain hub in Lagos South Africa Crypto News: MoneyBadger raises $400,000 to drive Bitcoin payments Kenya Crypto News: Government considers introducing “Travel Rule” in the VASP bill The post Africa Crypto News Week: Sui Foundation Launches Hub In Nigeria, MoneyBadger Raises $400,000 As Kenya Considers Crypto “Travel Rule” appeared first on 99Bitcoins.
-
Altseason: 3 Signals Investors Should Watch For – Analyst
um tópico no fórum postou Redator Radar do Mercado
Aside from a new all-time high in the Bitcoin market, the last trading week also heralded some altseason shouts as a slight price decline by the premier cryptocurrency coincided with significant price rallies by major altcoins. A popular market analyst with the X username PlanD has weighed in on these recent market developments, highlighting three factors that would confirm the presence of an altseason. A BTC.D Retest At 63% May Mark Crucial Altseason Moment – Analyst Over the last week, a bullish rise in the altcoin market cap to $1.45 trillion sparked widespread speculations about the current status of the altseason. Interestingly, in an X post on July 19, PlanD outlines three market events that will signal the altseason’s commencement, namely a potential pullback in both Bitcoin and Ethereum, alongside a critical technical development in Bitcoin dominance (BTC.D). Following Bitcoin’s ascent beyond $121,000 and Ethereum’s price rise above $3,400, PlanD says the first two signals to watch for are healthy corrections in these assets’ prices. Specifically, the analyst explains that pullbacks toward the $111,000 and $3,250 regions for Bitcoin and Ethereum, respectively, present an ideal situation that would allow capital to rotate from Bitcoin into altcoins, effectively causing a decline in BTC.D. Far from indicating weakness, PlanD says this retracement could actually catalyze the rise broader crypto market. Notably, if Ethereum finds support at $3,250, the ETH/BTC pair could strengthen, creating a favorable setup for altcoin rallies. This is because a stronger ETH/BTC pair is often a precursor to altcoin outperformance, as it signals increased investor appetite beyond Bitcoin. The third and perhaps most pivotal signal is unfolding in Bitcoin dominance. After months of holding above a rising support trendline, Plan D notes BTC.D has broken below it, signaling a potential change in market structure. However, the next test lies at the 63.40% dominance level. Should BTC.D retest this zone and fail to reclaim it, the analyst believes a new downtrend in dominance may begin, i.e., presenting the largest hallmark of altseason. In case of this scenario, PlanD also tells investors to expect strong bullish momentum in tokens linked to sectors such as real-world Assets (RWA), artificial Intelligence (AI), and gaming beyond the large and medium-cap tokens on popular blockchains. Crypto Market Overview At the time of writing, the total crypto market cap is valued at $3.83 trillion following a 0.20% decline in the past day. More data from CoinMarketCap shows the Fear & Greed index sits at 69, suggesting a healthy level of risk appetite from investors. Importantly, the altseason index ranks at 42, indicating a rising momentum in the market’s favor for altcoins.