

Todas Atividades
Atualizada automaticamente
- Hoje
-

Hold On For Dear Life: This Bullish Bitcoin Metric Just Touched A 15-Year High
um tópico no fórum postou Redator Radar do Mercado
The percentage of Bitcoin’s long-term holders’ supply has reached a 15-year high, providing a bullish outlook for the flagship crypto. Asset manager Ark Invest highlighted this development in a recent report and explained what this could mean for BTC going forward. Bitcoin Long-Term Holders Supply Hit 74% According to the Ark Invest report, the long-term holders’ supply has reached 74% of Bitcoin’s total supply, marking a 15-year high for this metric. The asset manager noted that this trend indicates growing market conviction in BTC’s role as a store of value or “digital gold.” These long-term holders refer to addresses that have held for 155 days or longer. This development comes at a time when Bitcoin is witnessing massive demand from institutional investors through the ETFs and treasury companies. These investors are considered better ‘diamond-hands’ than retail investors, which means that this metric could keep rising, with long-term holders gaining more control of BTC’s total supply. This institutional buying has also driven the Bitcoin price to several all-time highs (ATHs) this year, with BTC reaching as high as $123,000 last week. The flagship crypto appears to still be in price discovery, as ETFs led by BlackRock and treasury companies, led by Saylor’s Strategy, continue to accumulate at an unprecedented pace. Cathie Wood’s Ark Invest is ultra bullish on the Bitcoin price, predicting that it could reach $1.5 million by 2030. They expect BTC to reach this target due to the rising institutional investment and global recognition of Bitcoin’s ability to serve as a store of value. In a CNBC interview, Cathie Wood also doubled down on this prediction. She explained that they expect BTC to take a significant share from gold or grow the store of value market. Wood added that institutions are still just testing the waters despite the massive accumulation so far. As such, she still expects a rise in adoption for these companies. Meanwhile, only about 1 million unmined Bitcoins are remaining. Other Bullish Metrics For BTC The Ark Invest report also revealed that global liquidity per bitcoin reached a 12-year high. This metric reached this high with $5.7 million in global M2 supply per BTC in circulation. The asset manager remarked that this ratio could continue to rise given Bitcoin’s diminishing future supply growth and the continued expansion of global liquidity. Meanwhile, in June, Bitcoin managed to hold above the support between $96,000 and $99,000 and is now well above these levels. $98,888, $96,278, and $71,393 are BTC’s short-term holder cost basis, 200-day moving average, and on-chain mean, respectively, which is why this development is bullish for the flagship crypto. At the time of writing, the Bitcoin price is trading at around $19,100, up in the last 24 hours, according to data from CoinMarketCap. -
Too Pricey? Expert Says XRP Beats Bitcoin And Ethereum Right Now
um tópico no fórum postou Redator Radar do Mercado
In 2025, many first‑time crypto buyers could be hunting for an affordable entry point. Bitcoin is near $120,000 and Ethereum trades above $3,500. At around $3.60, XRP looks easier on the wallet yet still sits third in market cap. That sweet spot of price and reputation has caught the eye of retail investors. Retail Investors Priced Out According to EasyA co‑founder Dom Kwok, the high cost of Bitcoin and Ethereum is pushing newcomers toward cheaper tokens. He says that when a single Bitcoin hits six figures, it feels out of reach. XRP, by comparison, offers big‑league standing without the sticker shock. That mix of affordability and credibility is drawing a wave of small buyers. Based on reports from past crypto cycles, tokens with low unit prices tend to grab attention. It can be remembered that Shiba Inu used to trade at roughly $0.00000000001. Buyers could scoop up billions for just a few dollars. Dogecoin rode a similar hype wave. XRP stands apart because it actually moves money across borders quickly and cheaply. That real‑world use adds a layer of trust missing in many meme coins. Mixed Signals From Legal Battle According to updates on Ripple’s US lawsuit, the final court ruling could swing sentiment dramatically. A win for Ripple might cement XRP’s appeal and keep retail flows strong. A loss could spook buyers and send prices tumbling. Retail investors are quick to react when legal clouds clear one way or the other. Holder Base Dominated By Small Players Based on the XRP Rich List, nearly 6.7 million wallets hold the token today. Of those, about 5.7 million belong to retail investors—accounts with under 1,000 XRP. Within that group, close to 3 million wallets have between 0 and 20 tokens, while 2.52 million wallets carry between 20 and 500. This broad distribution shows that everyday buyers have already jumped in, rather than just big institutions. According to several market watchers, excitement in the XRP community is palpable. Analysts predicted more XRP millionaires than Bitcoin millionaires. Many holders believe the token is still in its early days despite its 2012 debut. Critics warn that runaway optimism can reverse fast if the broader market cools down. Looking Ahead On Market Mood Based on current trends, XRP’s low price and high rank could keep retail interest alive—at least until something new steals the spotlight. If Bitcoin dips under $100,000 or a fresh token captures headlines, retail flows may shift again. For now, though, XRP’s $3.55 price tag and large‑cap status have made it the token to watch for many first‑timers seeking their first crypto win. Featured image from Judicature – Duke University, chart from TradingView -
Yen Jumps as Governing Coalition Loses Majority in Upper House
um tópico no fórum postou Redator Radar do Mercado
Overview: The US dollar begins the new week with a softer bias, but it still needs to run the North American gauntlet, which has tended to be more constructive than other centers recently. As seemed likely, less than a year after losing its majority in the lower, the LDP and Komeito coalition lost its majority in the upper chamber yesterday. Japanese domestic markets were closed for a national holiday, but the yen strengthened om the news, even before the US 10-year yield extended its pullback for the fourth consecutive session. The greenback is mostly softer against the G10 currencies and most emerging market currencies today. Except for Taiwan and Australia, most large equity markets rose in the Asia Pacific region. Europe's Stoxx 600 is little changed and US index futures are slightly firmer. Benchmark 10-year yields are softer. In Europe, yields are mostly 3-5 bp lower and the 10-year Treasury yield is off a little more than three basis points to about 4.38% to slip below last week's low. Gold is trading firmly but must resurface last week's high a little above $3377 to lift the tone. August WTI reversed lower after reaching after setting the week's high before the weekend almost $69. Follow-through selling today has seen it slip slightly through $66.90. The 200-day moving average is near $66.70. USD: From the July 1 low through last Thursday's high, the Dollar Index appreciated by almost 2.7%. Although DXY was softer ahead of the weekend, it settled near session highs, as once again North American participants seemed to have a more constructive attitude toward the dollar than other centers. The Dollar Index is but softer within last Friday's range. A move above 99.00 could signal a test on the June 23 high closer to 99.40. Last Wednesday's low near 97.70 is important. A break of it will strengthen ideas that the upside correction is over. This is a relatively quiet week for US data, and Fed officials will be quiet ahead of the FOMC meeting at the end of the month. The notable exception is Fed Chair Powell's welcoming remarks at a regulatory conference tomorrow. On tap today is the index of leading economic indicators, which does not typically elicit much of a market response. EURO: The ECB meeting on Thursday is the highlight of the week, but the risk of a surprise rate cut seems slim to none. The euro's downside correction this month is the fifth this year that lasted a week or more. It has lasted about two-and-a-half weeks in duration so far and the magnitude of the pullback (~2.3%) is less than the average correction (~3.2%). An average pullback would take it to around $1.1450, which is where the (50%) retracement of the rally since mid-May is found, while the (38.2%) retracement is near $1.1535. That said, we remain more inclined to suspect that the euro's correction is over or nearly so and a move above $1.1720-25 boosting our confidence. A move above last Friday's high (~$1.1670) would be constructive. The session high has been recorded in the European morning slightly above $1.1650. Options for 1.8 bln euros at $1.1640 expire today. CNY: Last Wednesday's range remains important for the dollar against the offshore yuan (~CNH7.1685-CNH7.1920). Beijing wants a broadly stable dollar-yuan exchange rate. So, while the dollar declines, the yuan tends to decline against most other currencies, but when the dollar is trading higher, like it has this month, the yuan tends to appreciate against its other trading partners. That is very much the case. The yuan has risen against all the G10 currencies here in July, and most emerging market currencies. The PBOC has been bringing down the dollar's fix. The low fix last week was the lowest since early November 2024. Today's reference rate was set at CNY7.1522 (CNY7.1498 before the weekend. It is the fifth increase in the last six sessions. Unsurprisingly, Chinese banks left their loan prime rates steady at 3.0% and 3.5% for one- and five-year tenors, respectively. Given the low rate of inflation, real interest rates seem high, but Chinese officials seem in no hurry to cut rates. While the conventional narrative attributes the low inflation to weak consumption, we argue it is more a function of over-investment. In recent weeks, Beijing has expressed concern about the excess capacity, and this may be echoed by the politburo meeting expected to take place in the last week of the month. We also have highlighted that Chinese companies have access to patient capital (state-owned banks), which affords them the opportunity to compete for market share. In contrast, companies in the US rely more on impatient markets that want to see earnings growth on a quarterly basis, spurring competition for profits rather than market share. JPY: The release of government stockpiles of rice drove the price to a five-month low, but it did not prove sufficient for the LDP and its junior coalition partner, Komeito to retain its majority in the upper house. The coalition fell three seats shy. The last three LDP prime ministers that lost an upper house majority left office within two months of the loss. Some think that the agriculture minister and son of the former prime minister, Koizumi, has gotten high marks for the pullback in rice prices and is a potential successor to the beleaguered Prime Minister Ishiba. The dollar continues to trade within last Wednesday's trading range (~JPY146.90-JPY149.20). It is heavier today, and in a roughly JPY147.70-JPY148.65 range. The robust, even if not stable, 30-day correlation between changes in the exchange rate and changes in the 10-year US Treasury yield suggests it may offer directional clues. The six-week-old cap around 4.50% on the US 10-year yield held last week. It is off three basis points today to around 4.37%. Last week's US TIC data show private sector foreign demand for Treasury bonds was strong. They bought almost $120 bln of Treasuries in May after having bought a cumulative $172 bln in the previous four months. GBP: Despite a string of disappointing UK data, sterling looked like it formed a base last week around $1.3365-75. It recovered a cent before the weekend but was turned back in North America. It has largely held above $1.3400 today and reached $1.3465 in early European activity. A move above the $1.3475-85 area would help lift the technical tone. Options for almost GBP700 mln at $1.3475 expire today. CAD: The greenback set the high for the month last Thursday near CAD1.3775. It had started the session around CAD1.3680. That range is important. The high was in front of more formidable resistance near CAD1.3800, and the low was the upper end of a band of support extends to CAD1.3650. It is trading in an exceptionally narrow range today, ~CAD1.3710-CAD1.3735. Options for about $715 mln struck at CAD1.3745 expire today. The Bank of Canada's business surveys will be released today. They typically are not impactful. The swaps market expected the central bank to remain on hold here in Q3 and has slightly less than a 50% chance of a cut in October is discounted. AUD: The Australian dollar recovered from around $0.6455 on Thursday to slightly above $0.6540 ahead of the weekend. In one fell swoop, it retraced (61.8%) of the decline from the July 11 high for the year (~$0.6595). But it was not able to sustain the upside momentum and returned to almost $0.6500 in the North American afternoon. It is trading quietly today, between $0.6500 and $0.6525. There are A$820 mln options at $0.6500 that expire today. A close below the $0.6480 area would sour the near-term technical tone. The minutes from the recent Reserve Bank of Australia meeting will be released early tomorrow and are expected to underscore the message from Governor Bullock that the surprise decision to stand pat turned on the timing not the direction of travel. After last week's disappointing employment report and a jump in the unemployment rate, the futures market is even more confident of a rate cut at next month's meeting. The current cash rate target is 3.85% and the futures market implies a year-end rate of a little less than 3.20%. That suggests in the next four meetings, the futures market is discounting two cuts fully and around a 60% chance of a third. Lastly, we note that a softer Q2 inflation report helped encourage speculation that the Reserve Bank of New Zealand will cut rates when it meets next month. The implied odds in the swap market rose to about 85% today from about 68% before the weekend. MXN: The US dollar spent the last three sessions coiling with last Tuesday's range of roughly MXN18.65 to MXN18.8850. It continues to coil today in about a MXN18.6940-MXN18.7475 range. Daily momentum indicators are constructive. As a proxy for the near-term trend, the five- and 20-day moving average is useful. The dollar's five-day moving average has been below the 20-day moving average since mid-April. They may cross today or tomorrow. Given carry, if one is already a long peso, one is still being paid to be long. If one is looking to buy pesos, be patient but opportunistic. The upside risk may extend toward MXN19.00. The mid-July CPI, due Thursday is the data highlight, and the headline right may have softened for the third consecutive time. Disclaimer -
Dogecoin Rally On Thin Ice: Analyst Predicts Sudden Shakeout
um tópico no fórum postou Redator Radar do Mercado
Dogecoin begins the new trading week in an unusually precarious spot on its higher‑time‑frame chart: technically triumphant, yet visibly stretched. A cluster of weekly studies shared by pseudonymous market technician Cantonese Cat shows the meme‑coin pressing into resistance after an abrupt two‑week rally that added roughly 80 percent from the June lows. The analyst cautions that the move, though structurally bullish, may require a brief pullback to consolidate before further gains. Dogecoin Overextended? On the logarithmic Fibonacci retracement drawn across the 2024–25 range, last week’s candle managed to close marginally above the 0.618 level at $0.262 — a zone that has capped every breakout attempt since January. The close was technically significant: in classical market geometry, recapturing the 61.8 percent retrace often signals a transition from recovery to trend expansion. “It broke above the 0.618 log fib which can use a bullish back‑test,” Cantonese Cat observed, adding that a return to that same area “would flush back down to back‑test” the double‑bottom that formed around $0.15 earlier in the quarter. The Bollinger‑Band panel underscores the risk of near‑term mean‑reversion. Dogecoin’s weekly close at $0.267 is the first in eleven months to settle outside the upper band, which currently sits near $0.262. Such closes are rare on a high‑time‑frame chart and are typically followed by at least one candle that re‑enters the bands. “It’s above the Bollinger band,” the analyst notes. Historically, Dogecoin has struggled to maintain altitude when that spread becomes extreme, often retreating to the middle band — now near $0.19 — or, in stronger cycles, to the upper band itself on the subsequent week. The Ichimoku snapshot tells a similar story of progress meeting inertia. Price has vaulted both the conversion line (Tenkan‑sen) and the baseline (Kijun‑sen), confirming bullish momentum on those metrics, but remains pinned beneath the underside of the weekly cloud. The Senkō Span B that defines that lower cloud boundary sits around $0.28–$0.29, almost exactly where Dogecoin stalled on the final trading day of last week. Cantonese Cat labels that area “Ichimoku cloud resistance” and warns that until a decisive close pierces the cloud, the level should be treated as supply. A brief dip, therefore, would allow the Kijun‑sen (roughly $0.23) and the 0.618 Fibonacci level to compress into a confluence that could provide the next higher low. Supporting that idea is the supply‑demand band highlighted in grey on the fourth chart. It spans approximately $0.24 to $0.25 and corresponds to the base of February’s breakdown range. In chart‑pattern terms, the area acts as the neckline of the double‑bottom Cantonese Cat references. A retracement into that former resistance‑turned‑support could satisfy both the Fibonacci back‑test requirement and the Bollinger re‑entry, while leaving the broader reversal structure intact. The analyst sketches exactly that path on the chart: a pullback into the grey zone, followed by a renewed advance toward the mid‑$0.30s. Importantly, none of these observations undermine the longer‑term shift in market structure. The double‑bottom around $0.15 resolved higher in July with a weekly candle that engulfed eleven weeks of prior supply, signalling a change of control from sellers to buyers. The most recent candles, though smaller, have held every gain from that breakout. As the analyst summarizes: “Overall, these are very bullish developments, even if it dips down early this week to reset some technicals.” At press time, DOGE traded at $0.277. -
Is XRP the New Bitcoin? Ripple Ledger Surges as Price Hits Multi-Year High
um tópico no fórum postou Redator Radar do Mercado
XRP just blew past its 2018 high, hitting $3.70 as daily transaction volume on the XRP Ledger surged 50% to $1.4 billion. This is a full ecosystem breakout. Activity across the XRPL is accelerating at a record pace, drawing fresh attention from both institutions and retail traders. Can XRP break $10 this year? Here’s our prediction below: “We’re witnessing an unprecedented spike in XRPL activity, marking renewed confidence from both the developer ecosystem and institutional players.” – David Schwartz, CTO at Ripple (XRPUSDT) DISCOVER: 9+ Best High-Risk, High-Reward Crypto to Buy in July 2025 Donald Trump: XRP All-Time High Soon? Open interest in XRP derivatives is climbing alongside spot activity. We’ve got a textbook golden cross on the chart: the 20-day SMA has just crossed above the 200-day SMA, signaling bullish momentum. That’s already attracting short-term attention and could signal a broader trend reversal if volume follows through. With the MACD and signal line now both above zero, XRP has locked in a bullish crossover that strengthens the case for continued upside. On the policy front, the token’s perceived acceptability in Washington could give it the kind of regulatory breathing room other projects lack. Most importantly, we’re seeing what looks like a cup and handle pattern forming. If XRP can break above the $3.52 level with strong volume, that would likely confirm the breakout. Key support levels to watch: $3.44: Local support near Bollinger Band midline $3.35: Handle bottom and psychological level $3.28: 200-day SMA, strong longer-term base DISCOVER: Next 1000X Crypto: 10+ Crypto Tokens That Can Hit 1000x in 2025 New XRP All-Time High Coming Soon? XRP is currently hovering around $3.54, just shy of its $3.66 all-time high. If it maintains support above $3.38, a retest—and potential break—of those highs is likely. Meanwhile, XRP dominance (XRP.D) is approaching 5.75%, a key resistance level untouched in over 2,200 days. If this level is cleared, XRP could be poised for explosive price action toward the $7–$10 range, according to multiple 99Bitcoins analysts. Final Thoughts: XRP May Lead the Next Altcoin Leg XRP is flashing all the classic signs of a top-performing altcoin entering the next bullish phase: high transaction activity, surging price, rising derivatives interest, White House support, and institutional ETF rumors. That said, warning signs from new wallet data and HODLer behavior suggest a short-term pullback or consolidation could be next. Watch the 0.038 BTC resistance on the XRP/BTC chart and the 5.75% mark on XRP.D for the next signal. If history repeats, XRP’s biggest run might still be ahead. VISIT BTC BULL Token EXPLORE: Tether CEO Paolo Ardoino Hopes For Net Positive From US Elections, Says Bitcoin Strategic Reserve Is A Great Idea: 99Bitcoins Exclusive Join The 99Bitcoins News Discord Here For The Latest Market Updates Key Takeaways XRP just blew past its 2018 high, hitting $3.70 as daily transaction volume on the XRP Ledger surged 50% to $1.4 billion. XRP could be poised for explosive price action toward the $7–$10 range, according to multiple 99Bitcoins analysts. The post Is XRP the New Bitcoin? Ripple Ledger Surges as Price Hits Multi-Year High appeared first on 99Bitcoins. -
The Highly Desirable 1841-O Seated Liberty Half-Dime
um tópico no fórum postou Redator Radar do Mercado
The 1841-O Seated Liberty Half Dime is a cherished numismatic gem minted at the New Orleans Mint during a formative period in United States history. American history buffs will recall that presidential transition and westward expansion as part of “Manifest Destiny” dominated the national scene in 1841. 1841: A Memorable Year in American Presidential History In an unusual year, America saw three different U.S. presidents sit in the White House in 1841. President Martin Van Buren’s term ended, William Henry Harrison was inaugurated, only to die shortly after from pneumonia, and his Vice President, John Tyler, assumed the presidency. In 1841, the American economy was still recovering from the Panic of 1837, and the nation was confronting controversial issues, including banking reform, states’ rights, and the debate over slavery. Against this backdrop, the U.S. Mint played a critical role in supporting commerce and the growing population by producing trusted gold and silver coinage. New Orleans Mint Quickly Became a Critical Southern Institution Congress authorized the New Orleans branch mint in 1835, and it quickly became a significant southern institution, producing millions of gold and silver coins for the rapidly growing population of the South. Its strategic location near the Gulf of Mexico facilitated the distribution of coinage throughout the Mississippi Valley and beyond. Today, the “O” mintmark is treasured within the numismatic community, especially among southern specialists. Coins minted at the New Orleans mint often saw heavy circulation in the dynamic port city and surrounding regions. Seated Liberty Half Dime Series The Seated Liberty Half Dime series was minted from 1837 to 1873. It replaced the earlier Capped Bust design. These half dimes were among the smallest silver denominations in U.S. coinage, valued at five cents—hence the name “half dime.” The half dime series is celebrated for its elegant portrayal of Liberty and its adaptability to changing artistic tastes and minting technology over the decades. Christian Gobrecht, the Chief Engraver of the U.S. Mint, designed the Seated Liberty half dime, along with contributions from sculptor Robert Ball Hughes. The obverse features Liberty seated on a rock, holding a shield in one hand and a liberty pole in the other, symbolizing vigilance and freedom. The reverse displays a decorative wreath surrounding the denomination. Over the years of minting the Seated Liberty half dime series, slight modifications were made, such as the addition of drapery to Liberty’s elbow and changes to the number of stars. The 1841-O Seated Liberty Half Dime is a prized collectible with high grades that are hard to find. The Seated Liberty Half Dime series is popular among collectors who aim to assemble complete date-and-mintmark sets. The 1841-O is an essential, yet elusive, piece in that collection. This coin, minted at the New Orleans Mint during an exciting time in our nation’s history, is a tangible link to the antebellum South and is a window into the history of America. The extremely low survival rate in high grades makes it an especially rewarding acquisition for collectors. Blanchard recently placed this historic ultra-rarity. Here at Blanchard, we regularly place highly sought-after coins like the 1841-O Seated Liberty Half Dime with collectors. Blanchard has owned and sold more than half of the coins in Whitman Publishing’s 100 Greatest U.S. Coins list. If you are searching for a specific classic American coin, let us know today. We have deep roots in the numismatic community and are often able to source challenging and hard-to-find coins. The post The Highly Desirable 1841-O Seated Liberty Half-Dime appeared first on Blanchard and Company. -
Will Bitcoin crash? The answer is YES, if the U.K. has its say so. British officials are preparing to dump a crypto fortune of over 61,000 BTC ▲0.40% tied to a busted Chinese Ponzi scheme onto the market. The U.K. just never gets any breaks, does it? This is the largest crypto seizure ever liquidated by a Western state, and it’s happening just as Chancellor Rachel Reeves looks for ways to plug a widening fiscal hole for 2025. But the move is already drawing criticism, with investors asking if Britain is once again selling the future to patch the present. BitcoinPriceMarket CapBTC$2.36T24h7d30d1yAll time DISCOVER: Next 1000X Crypto: 10+ Crypto Tokens That Can Hit 1000x in 2025 Will Bitcoin Crash? A Budget Crisis Meets the UK’s Crypto Stash With Britain facing a shortfall of up to £20 billion, the Treasury believes selling its cache of digital assets, which are tied to a multi-billion-dollar Chinese fraud scheme, could generate more than £5 billion based on current prices. The comparison to Gordon Brown’s infamous gold sale lingers in the background. In the early 2000s, Brown sold off nearly half of the U.K.’s gold reserves at a generational low, just $275/oz. Today, that gold is worth over $3,300/oz, making the decision one of the worst-timed selloffs in modern financial history. Now, critics are asking whether Bitcoin — up more than 1,000% over five years — is next to make the U.K. eat crow. DISCOVER: 20+ Next Crypto to Explode in 2025 Regulatory Signals and U.S. Collaboration Chancellor Reeves has publicly called for closer coordination with U.S. regulators to build more consistent global crypto frameworks. This is what makes the U.K.’s upcoming Bitcoin sale even stranger, and it could become a case study in how governments handle digital asset seizures. For now, Britain is content to play second fiddle in the digital asset race, letting U.S. regulators define the rules of engagement. Could the Sale Rattle Bitcoin Markets? With BTC cruising at $117K, the idea of 61,000 coins hitting the open market has traders watching closely. No one expects a full-on dump but even a slow drip of that scale can twist sentiment fast. Volatility is back on the menu, boys, and, in some cases, ‘gals? How the U.K. handles this sale — legally, economically, and operationally — will shape international standards for public asset recovery in the crypto age. EXPLORE: Tether CEO Paolo Ardoino Hopes For Net Positive From US Elections, Says Bitcoin Strategic Reserve Is A Great Idea: 99Bitcoins Exclusive Join The 99Bitcoins News Discord Here For The Latest Market Updates Key Takeaways Will Bitcoin crash? The answer is YES, if the U.K. has its say so. British officials are preparing to dump a crypto fortune of over 61,000 BTC. No one expects a full-on dump but even a slow drip of that scale can twist sentiment fast. The post Will Bitcoin Crash? UK Home Office Plans to Liquidate $7 Billion Bitcoin to Boost Public Finances appeared first on 99Bitcoins.
-
Asian Market Wrap Asian stocks and the yen stayed steady on Monday after Japanese elections delivered bad news for the government, but nothing worse than expected. Meanwhile, Wall Street is gearing up for earnings reports from major tech companies. Most Read: July PMI Week, NZ Inflation and ECB's Rate Decision – Markets Weekly Outlook Investors are also hoping for progress in trade talks before President Donald Trump's August 1 tariff deadline. US Commerce Secretary Howard Lutnick remains optimistic about reaching a deal with the European Union. There are also reports that Trump and China's leader Xi Jinping are getting closer to setting up a meeting, though it likely won’t happen until October. In the meantime, European Commission President Ursula von der Leyen is ahead of the game and will meet with Xi on Thursday. close Source: TradingView.com (click to enlarge) Source: TradingView.com (click to enlarge) Follow Zain on Twitter/X for Additional Market News and Insights @zvawda Opinions are the authors'; not necessarily that of OANDA Business Information & Services, Inc. or any of its affiliates, subsidiaries, officers or directors. The provided publication is for informational and educational purposes only. If you would like to reproduce or redistribute any of the content found on MarketPulse, an award winning forex, commodities and global indices analysis and news site service produced by OANDA Business Information & Services, Inc., please refer to the MarketPulse Terms of Use. Visit https://www.marketpulse.com/ to find out more about the beat of the global markets. © {CURRENT_YEAR} OANDA Business Information & Services Inc.
-
The Japanese yen has started the week with strong gains. In the European session, USD/JPY is trading at 147.71, down 0.73% on the day, Japanese PM on shaky ground after election drubbing Japanese Prime Minister Ishiba's ruling coalition failed to win a majority in the election for the upper house of parliament on Sunday. The result is a humiliating blow to Ishiba, as the government lost its majority in the lower house in October. The stinging defeat could be the end of the road for Ishiba. The Prime Minister has declared he will remain in office, but there is bound to be pressure from within the coalition for Ishiba to resign. Opinions are the authors'; not necessarily that of OANDA Business Information & Services, Inc. or any of its affiliates, subsidiaries, officers or directors. The provided publication is for informational and educational purposes only. If you would like to reproduce or redistribute any of the content found on MarketPulse, an award winning forex, commodities and global indices analysis and news site service produced by OANDA Business Information & Services, Inc., please refer to the MarketPulse Terms of Use. Visit https://www.marketpulse.com/ to find out more about the beat of the global markets. © {CURRENT_YEAR} OANDA Business Information & Services Inc.
-
Not Even Bitcoin Is Safe: Kiyosaki Warns Of Massive Market Collapse
um tópico no fórum postou Redator Radar do Mercado
Veteran investor Robert Kiyosaki has sounded a stark warning for markets that have just seen Bitcoin hit a fresh all‑time high of $123,000. According to Kiyosaki, long‑running bubbles in the US economy are primed to burst, and Bitcoin could slide right along with stocks and bonds. The cryptocurrency is already off its peak, trading past the $118,000 mark after profit‑taking by long‑term holders. Major Debt And Sticky Inflation Based on reports, the US national debt has climbed to over $36 trillion, a level few would have imagined a decade ago. At the same time, June’s Consumer Price Index shows inflation isn’t cooling as fast as hoped. Those figures have left many investors on edge. Kiyosaki, who has championed Bitcoin as a hedge against currency weakness, believes these pressures will trigger a broad market pullback. He warned that gold, silver and Bitcoin may see sharp corrections when the wider “bubbles” finally burst. Still, he made it clear he views any drop as a chance to buy more. Whales Move To Exchanges On‑chain data tell a similar story of caution. According to Glassnode, the 7‑day simple moving average of whale‑to‑exchange transfers is approaching 12,000 BTC—the highest level seen in 2025 so far. That surge mirrors activity from November 24, 2024, when large holders began shifting coins onto trading platforms to lock in gains. Bitcoin has already climbed over 50% since its April lows, so some pullback was almost inevitable. Miners have also started moving coins, suggesting they too are taking profits. Firms Double Down On Bitcoin Institutional appetite remains strong, even amid talk of a crash. Twenty‑one firms added roughly $810 million of Bitcoin to their balance sheets last week alone as part of their treasury plans. Spot Bitcoin ETFs are still drawing steady inflows, offering a regulated path for investors to gain exposure. Those continued purchases could soften the blow if a bigger sell‑off takes hold. Market observers see a tug‑of‑war playing out. On one side, big holders are cashing in after a historic rally. On the other, companies and funds are piling in, betting that any dip will be short‑lived. Short‑term traders may try to ride the volatility. Long‑term backers, like Kiyosaki, are eyeing deeper discounts before they pull the trigger on new buys. The coming weeks could test Bitcoin’s resilience. If debt concerns and stubborn inflation dominate headlines, volatility may spike. Yet the ongoing institutional support and Kiyosaki’s buy‑the‑dip stance hint that any slide could set the stage for a fresh rally. Featured image from Meta, chart from TradingView -
Asia Pacific stock markets opened the week on a mixed note. Singapore’s Straits Times Index (STI) led the pack, surging 0.5% intraday to a new all-time high of 4,225, breaking above the psychological 4,200 mark and continuing its bullish run. close Fig 2: Gold (XAU/USD) minor trend as of 21 July 2025 (Source: TradingView) Fig 2: Gold (XAU/USD) minor trend as of 21 July 2025 (Source: TradingView) The recent minor sideways range compression of Gold (XAU/USD) in place since 3 July has reached a potential tipping point for at least a minor breakout scenario. Two key elements have increased the odds of a bullish breakout scenario. Firstly, Gold (XAU/USD) has retested the medium-term ascending trendline support in place since 31 December 2024 low for the third time on last Thursday, 21 July. Secondly, in conjunction with the third retest on the medium-term ascending trendline support of Gold (XAU/USD), the hourly MACD trend indicator has traced a bullish divergence condition on 17 July, inched higher, and staged a MACD-Signal line bullish crossover in today’s Asia session at this time of writing. Watch the US$3,328 short-term pivotal support, and a clearance above US$3,374 upside trigger level may see a minor bullish breakout unfolding for the next intermediate resistances to come in at US$3,400 and US$3,450 in the first step. On the flip side, failure to hold at US$3,328 invalidates the bullish scenario for another round of minor choppy corrective decline sequence to expose the next intermediate supports at US$3,309, and US$3,293/3,282. Opinions are the authors'; not necessarily that of OANDA Business Information & Services, Inc. or any of its affiliates, subsidiaries, officers or directors. The provided publication is for informational and educational purposes only. If you would like to reproduce or redistribute any of the content found on MarketPulse, an award winning forex, commodities and global indices analysis and news site service produced by OANDA Business Information & Services, Inc., please refer to the MarketPulse Terms of Use. Visit https://www.marketpulse.com/ to find out more about the beat of the global markets. © {CURRENT_YEAR} OANDA Business Information & Services Inc.
-
XRP Targets $6–$10 If Bitcoin Hits $144,000, Analyst Predicts
um tópico no fórum postou Redator Radar do Mercado
Pseudonymous market technician Dr Cat has laid out a tightly argued roadmap that would see XRP triple from its current range to between six and ten dollars within the next two months—provided Bitcoin’s ongoing advance carries the benchmark asset to $144,000. XRP Poised For $10 If This Happens In a series of posts over the weekend, the analyst noted that XRP’s monthly chart against BTC is “coiling” just beneath a crucial Ichimoku Cloud threshold at 2,674 satoshis. “If this month closes above 2 674 I think we should go at least to 4 135 in the next couple of months,” Dr Cat wrote, adding that such a close would deliver the first bullish monthly kumo twist for the pair since 2018 and place XRP in a “support‑and‑regain” configuration rarely seen in altcoins during the current cycle. The 4,135–7,600 satoshi band marks what Dr Cat calls the “resistance / take‑profit zone.” He argues that price seldom reloads immediately after such a multi‑year breakout and that a wick to the upper end of the zone is likely once momentum ignites. “All in all, if BTC goes to 144 K on this weekly move, this price range for XRP in USD translates to $6–$10,” the analyst told followers, pencilling the move in for August or September if Bitcoin’s trend steepens. Dr Cat conceded that the optimal risk‑reward evaporates above 7,600 sats—“Would you risk a 10× unrealised gain for another 0.7×?”—and said he would rotate out of the position even though longer‑term targets above $30 remain “plausible” into 2026. On the XRP‑USD chart the picture is similarly constructive. Sunday’s weekly close above $3.37 turned both the cloud and the Kijun‑sen higher and produced a textbook Chikou Span breakout in week 27 of the Ichimoku time cycle, the so‑called Henka‑Bi candle. Dr Cat’s price‑projection grid aligns traditional Fibonacci extensions with Ichimoku price‑measurement theory: the N‑wave objective sits at $4.53, the E‑wave at $6.31 and the 2E extension at $9.22. “With the condition of this weekly close all of them are on the table for the next one to two months and $4.5 should be the absolute minimum,” he wrote, recalling that the same $4.5 target had been floated as “minimum” when XRP traded at $1.89 in early April. Market context lends partial support to the thesis. Bitcoin is trading just above $118,500 after a subdued weekend session, consolidating a 20 percent rally since the start of July, while ether holds near $3,760 and dominance continues to erode in favour of large‑cap altcoins. XRP itself is hovering around $3.55 following a 50‑percent weekly burst. Technically, the “monthly close above 2,674 sats” remains the gating criterion. A failure to secure that level would postpone the kumo twist and risk another quarter of range‑bound drift versus Bitcoin. Conversely, a decisive move into the 4,135–7,600 satoshi band would confirm the first bullish market‑structure shift on the long‑term ratio chart in seven years and almost certainly drive speculative flows into the XRP‑USD pair. Traders watching for additional confirmation will be tracking whether the Chikou Span can clear price on the weekly timeframe “this or next week”—a rare but powerful signal that the analyst warns could invalidate the “healthy cross” caveat and send the market vertical even before the textbook Tenkan‑Kijun crossover materialises. For now, the path to $6–$10 hinges on Bitcoin’s ability to extend its breakout toward the six‑figure mark. If the flagship asset stalls below $120,000 the proportional upside for XRP compresses; should the rally continue, Dr Cat’s stacked Ichimoku‑Fibonacci objectives argue that $4.5 comes first, $6 follows quickly and the fabled $10 print is finally “on the table” as the trifecta of cloud twist, time‑cycle symmetry and momentum converge. At press time, XRP traded at $3.55. -
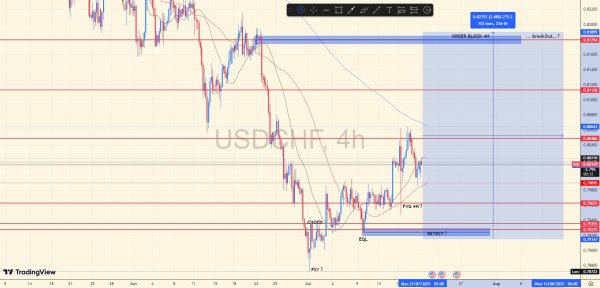 Perspectiva de análise RETEST em zona EQL após filtrar spring vermelho (FVG 4H), após 1 rejeição H1 (spring vermelho), é válido manter a RANGE dentro de EQL>ORDER BLOCK 4H para possível quebra de ORDERBLOCK 4H e breakOut de continuação. STOPLOSS não deve ser maior que o último spring vermelho PSY.
 -
The Final Bitcoin Act: Here’s What To Expect As BTC Trends Sideways
um tópico no fórum postou Redator Radar do Mercado
Bitcoin has already shown a lot of strength in recent times, pushing as high as $123,000 before trailing back down toward $117,000. So far, it looks like the digital asset has hit a roadblock and is now possibly looking at a peak. But analyst Merlijn The Trader has explained that it is far from over for Bitcoin with more rallies to come. He reveals that the Bitcoin price is yet to stage its ‘final act’, which must happen before there are talks of a top. Bitcoin 4-Year Cycle Is Still In Play After the Bitcoin price rallied to new all-time highs pre-halving, which had never happened before, there were talks that the 4-year cycle had been broken. For clarification, the 4-year cycle is tied to the Bitcoin halving events, which take place every four years, cutting block rewards for miners in half. However, the reduction in block rewards is not the only interesting thing about the 4-year cycle, because each halving also ushers in a new bull market. This has been the case for the past three bull cycles, and Bitcoin is also expected to follow this. Historically, the market rallies for around a year after the halving, with the top being reached one year later. Going by this trend, the Bitcoin price and the crypto market at large are expected to keep rallying before topping later this year. Pointing to this 4-year cycle, the analyst forecasts another stretch of price increases. The chart shows that price often declines for one year and then rallies for three years, and so far, the Bitcoin price has only been rallying for two, leaving 2025 as another year for rallying. Additionally, Bitcoin is still a long way from levels that have previously marked the top of previous bull markets. Thus, there is still a while before it hits its peak in 2025. Besides, each bull cycle has seen Bitcoin rise 3x higher than its previous all-time highs, and it is year to hit even 2x higher than its previous $69,000 high. How High Can BTC Go? If the 4-year cycle is still in play, then it means that the Bitcoin price rally is far from done. In the analyst’s chart, he shows the possible top for Bitcoin based on past cycles, and BTC is still in the middle of the box. The top of this box puts the BTC price at around $200,000 before a top can be reached. The analyst warns that Bitcoin is about to enter what he refers to as the “greenest stretch of them all”, pointing to another rally to all-time highs. If this forecast plays out, then Bitcoin is expected to see another 50% rally before the bull market is done. -
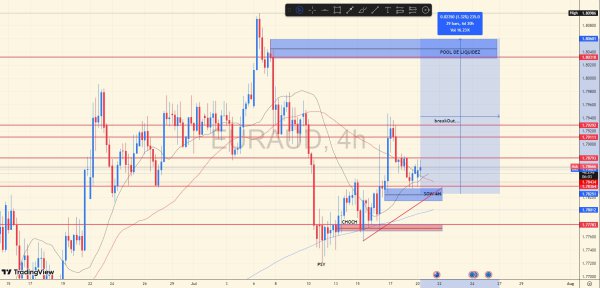 Perspectiva de análise Mais um teste na zona de SOW 4H, gerando rejeição e spring vermelho, em direção a zona a linha da última (HIGH HIGH), para testar o breakOut e seguir ao POOL DE LIQUIDEZ. Cautela: Pode criar uma acumulação entre SOW e breakOut até a quebra, gerenciamento parcial é fundamental. STOPLOSS não deve ser maior que o último spring vermelho abaixo do CHOCH (zona vermelha).
 -
 🔍 Bitcoin e assinatura pró-cripto de Trump gerou alertas entre analistas institucionais 📌 Preço Atual: US$ 118.530,30 📈 Variação no dia: +1,3% 📊 Tendência de curto prazo: Altista moderada com sinais de exaustão 🧠 Contexto e Narrativa do Mercado Nas últimas 24h, o Bitcoin operou com forte viés emocional e institucional, impulsionado pelas expectativas de assinatura de leis pró-cripto por Donald Trump, e uma narrativa de "adoção do blockchain como base dos pagamentos do futuro". A declaração do assessor Bessent, alinhado à administração Trump, de que “o dólar em breve estará no blockchain” reforçou o sentimento de otimismo. Contudo, a euforia gerou alertas entre analistas institucionais, que observam o risco de um movimento clássico de “buy the rumor, sell the news” — especialmente com o BTC tendo subido mais de 12% nas últimas semanas, em antecipação à assinatura da nova legislação. ⚠️ Possível “Armadilha de Alta” no BTC: Analistas alertam para o padrão informalmente apelidado de "накуканивание" (popularizado entre traders russos), que caracteriza: Compras eufóricas no topo; Venda silenciosa por grandes players; Distribuição de liquidez enquanto o varejo continua comprando; E eventual queda abrupta para liquidar posições superalavancadas. Com o BTC superando os US$ 118.000, esse padrão pode estar se formando, à medida que os volumes institucionais diminuem e a dominância emocional do varejo aumenta. 📉 Impacto Esperado com Assinatura do Projeto por Trump: Caso o presidente assine hoje a legislação cripto, o impacto pode variar conforme a reação dos players institucionais: Cenário Reação Esperada Impacto no BTC "Buy the rumor, sell the news" Lucros realizados imediatamente Queda rápida para a zona de US$ 113.000–114.000 Confirmação institucional (fundo soberano, ETF, bancos) Entrada de capital nova Abertura de alvo em US$ 123.000–125.000 Ambiguidade legal no texto Incerteza Volatilidade e lateralização entre US$ 115.000–119.000 📍 Pontos Técnicos de Interesse Resistência imediata: US$ 119.800 – último topo intradiário Zona crítica de distribuição: US$ 120.000–121.000 Suporte de curto prazo: US$ 116.700 (pivô intradiário) Zona de liquidez inferior (stop hunts possíveis): US$ 114.400–113.000 📊 Índice de Força Relativa (RSI): 72 — em zona de sobrecompra 💰 Open Interest (dados derivativos): em alta, com concentração em calls acima de US$ 120K 🧭 O Que Esperar? Nas próximas horas: A assinatura de Trump pode ser um gatilho imediato para realização de lucros; Se houver confirmação de suporte institucional adicional (ex: FED, Tesouro, JP Morgan) ao setor cripto, o BTC pode tentar romper a zona dos US$ 120.000; Caso contrário, pullback corretivo saudável para a faixa de US$ 114K–115K é provável antes de nova perna de alta. 📌 Resumo do Analista Igor Pereira – ExpertFX School
 -
🇺🇸 Trump Redefine o Significado de “Acordo Comercial”: Tarifas Agora São Consideradas Negociações Nas últimas semanas, Donald Trump e membros de sua administração vinham prometendo à imprensa uma série de grandes acordos comerciais com diversas nações. No entanto, em vez de anúncios formais de pactos comerciais, o que se materializou foi o envio massivo de cartas tarifárias com ameaças de aumento de tarifas de importação. Segundo fontes de Washington, mais de 25 países já receberam essas “cartas de tarifas” — com o conteúdo prevendo tarifas punitivas de até 35% ou 40% sobre bens importados para os EUA. Trump ainda afirmou que pretende expandir essa ofensiva, enviando cartas para mais de 150 países. 🧾 “Cartas de tarifas” agora são consideradas acordos Durante uma conferência recente, Trump foi ainda mais direto ao declarar: Na prática, Trump está redefinindo o conceito de acordo comercial: enviar uma ameaça tarifária já é, segundo ele, um acordo. O conteúdo da “negociação” seria a imposição unilateral de tarifas como forma de forçar concessões comerciais. 📌 O que esperar e qual o impacto no mercado? 1. Aumento de volatilidade nos mercados globais: As bolsas asiáticas e europeias já reagem com cautela à possibilidade de uma nova onda protecionista. Commodities como cobre e petróleo tendem a sofrer diante da perspectiva de desaceleração comercial. 2. Reprecificação de ativos de risco: A imposição de tarifas sobre uma gama mais ampla de países pode levar a uma revisão das projeções de crescimento global. Isso tende a beneficiar ativos de proteção como o ouro (XAU/USD) e o iene japonês (JPY). 3. Potencial resposta internacional: Países afetados podem retaliar, desencadeando novas disputas comerciais multilaterais, como ocorreu na guerra comercial EUA-China de 2018-2019. Isso pode afetar exportadores europeus, latino-americanos e asiáticos. 4. Pressão sobre cadeias globais de suprimento: Tarifas elevadas aumentam custos logísticos e reduzem margens industriais — o que impacta empresas listadas no S&P 500, especialmente nos setores de tecnologia, automotivo e manufatura pesada. 🎯 Conclusão Analítica – Por Igor Pereira A nova abordagem de Trump é claramente coercitiva e voltada a maximizar concessões via pressão tarifária, não via diplomacia multilateral. Essa postura pode agradar setores industriais dos EUA no curto prazo, mas gera incertezas macroeconômicas relevantes para o médio e longo prazo. O mercado deve se preparar para um aumento na aversão ao risco, com potencial valorização do ouro (XAU/USD), do dólar americano (DXY) frente a moedas emergentes, e queda de ativos cíclicos e sensíveis a exportações. 📊 Acompanhe o fluxo institucional no ouro e os próximos pronunciamentos oficiais de Trump para avaliar pontos de entrada em ativos de proteção.
-
OURO (XAU/USD): Viés Altista Intacto, Mas Tensões Surpreende
um tópico no fórum postou Igor Pereira Sentimento de Mercado
📈 OURO (XAU/USD): Viés Altista Intacto, Mas Tensões Surpreende Por Igor Pereira – Analista de Mercado Financeiro | Membro WallStreet NYSE 🧭 Cenário Geral e Impactos Recentes O ouro (XAU/USD) permanece com viés altista mesmo diante de um ambiente de incertezas quanto à trajetória dos juros norte-americanos, fortalecimento do dólar e riscos geopolíticos crescentes. O metal subiu 0,17% nesta segunda-feira, sendo cotado a US$ 3.350,10, com a realização parcial de lucros após forte demanda por proteção nas últimas sessões. Apesar da retração intradiária, o ouro se mantém bem apoiado pela combinação de ameaças tarifárias, inflação resiliente e preocupações com a independência do Federal Reserve, todos fatores que sustentam sua atratividade como ativo de refúgio institucional. 🏴☠️ Fundamentos em Destaque Tensões Comerciais em Alta: O presidente Donald Trump confirmou tarifas de 30% sobre importações da União Europeia e México a partir de 1º de agosto, reacendendo receios de uma guerra comercial global. A medida provocou inicialmente uma onda de compras em ouro, mas o fôlego perdeu força após a UE adiar sua retaliação. Inflação Surpreende em Alta: O índice CPI de junho nos EUA avançou para 2,7% ao ano, complicando o cenário para cortes de juros. A inflação elevada alimentada por tarifas pode restringir a margem de manobra do Fed. Expectativas de Cortes em Queda: Apesar do tom dovish do governador Waller, os fortes dados de vendas no varejo e a queda nos pedidos de auxílio-desemprego reduziram as apostas de cortes de juros para 45bps até o fim de 2025, contra 50bps anteriormente. Dólar em Alta Pressiona Commodities: O Dollar Index (DXY) subiu 0,61%, tornando o ouro mais caro em outras moedas, o que pressiona sua cotação no curto prazo. Contudo, temores quanto à independência do Fed e a possibilidade de renúncia de Jerome Powell (conforme rumores recentes) mantêm suporte estrutural ao ouro. 🔍 Análise Técnica – XAU/USD O gráfico diário do ouro permanece com viés comprador (bullish bias) em contexto de “buy-the-dip”, onde recuos são vistos como oportunidades de entrada por grandes players institucionais. 📌 Níveis Técnicos Importantes: Resistência (UTAD) chave: $3.451,53 — o rompimento desse nível pode confirmar nova perna de alta com alvo em $3.518 e, posteriormente, $3.600. Suportes (Break Of Structure, BOS) relevantes: $3.310,48 (nível de pivô semanal) $3.244,41 (suporte estrutural e fundo recente) Chave: Enquanto o preço se mantiver acima de $3.310, o ouro continua operando em estrutura técnica favorável a compras, mesmo em meio a realizações de curto prazo. 📊 Expectativas para o Mercado O que esperar: Novas falas de Powell nesta terça-feira podem ser decisivas. Rumores indicam forte pressão da equipe de Trump para que o presidente do Fed renuncie, em meio à resistência em acelerar cortes de juros. Caso confirmada a renúncia, o impacto pode ser explosivo nos mercados, impulsionando ouro, treasuries longos e ativos defensivos, enquanto o dólar pode perder força temporariamente. Impacto no mercado financeiro: Caso o Fed seja percebido como politizado, a confiança institucional no dólar pode enfraquecer, ampliando a busca por proteção via ouro físico, ETFs e contratos futuros. Novas medidas retaliatórias da Europa ou México também podem elevar a volatilidade e sustentar o ouro acima dos $3.350. 🧠 Conclusão do Analista Igor Pereira O cenário para o ouro segue tecnicamente robusto, mesmo com oscilações táticas. O nível de $3.451 é o mais importante do momento, com potencial para liberar forte fluxo comprador caso rompido com volume. Enquanto isso, qualquer movimento abaixo de $3.310 ainda representa oportunidade de entrada estratégica, considerando a deterioração da estabilidade política nos EUA e o ambiente de juros real persistentemente negativo. No Clube ExpertFX atualizamos diariamente os níveis técnicos e análises detalhadas sobre XAU/USD. -
RUMORES SOBRE POWELL PODEM ABALAR OS MERCADOS
um tópico no fórum postou Igor Pereira Sentimento de Mercado
🚨 URGENTE: RUMORES SOBRE POWELL PODEM ABALAR OS MERCADOS (Análise Técnica e Fundamentalista – ExpertFX School) 🗞️ Resumo da Informação Segundo rumores que circulam nos bastidores de Washington e de fontes ligadas à administração Trump, o presidente do Federal Reserve, Jerome Powell, estaria sofrendo forte pressão do governo para reduzir as taxas de juros imediatamente. Relatos indicam que Powell pode anunciar sua renúncia já na próxima terça-feira, durante seu discurso programado. A recusa em cortar os juros teria motivado o impasse com a Casa Branca. 📊 O Que Isso Significa para o Mercado? 🔻Powell irá renunciar: Alta volatilidade nos mercados de renda variável e Forex; Rali especulativo no ouro (XAU/USD) como ativo de proteção; Dólar (DXY) pode sofrer liquidação inicial, mas com possível recuperação dependendo do sucessor; Criptomoedas podem se beneficiar temporariamente com a aversão ao risco institucional. 🏛️ Contexto Político: A administração Trump tem defendido abertamente uma política monetária mais expansionista, com foco em impulsionar os mercados e a economia no curto prazo. O Fed, por sua vez, tem adotado uma postura mais cautelosa frente aos sinais persistentes de inflação e superaquecimento em setores estratégicos. 🔮 Expectativas do Mercado: Caso o rumor se confirme na terça-feira, espera-se um aumento abrupto na demanda por ativos defensivos e um ambiente de incerteza institucional. Trechos do discurso de Powell devem ser analisados em tempo real por analistas e algoritmos institucionais. Um sucessor mais alinhado com Trump pode levar a cortes agressivos nas taxas ainda em 2025, o que traria impacto direto sobre Treasuries, commodities e ações de tecnologia. 🟡 Impacto no ouro (XAU/USD): Rompimento de resistências técnicas pode ocorrer em caso de renúncia, especialmente se o mercado antecipar um Fed mais dovish. Atenção especial à zona dos $3.275 – $3.290, com potencial para breakout até $2.420–$2.450. O ouro se fortalece como ativo de confiança em cenários de instabilidade institucional. 💬 Comentário do Analista Igor Pereira – ExpertFX School 📌 O que monitorar: Discurso de Powell na terça-feira (horário a confirmar); Reação imediata do mercado futuro de juros e swaps; Comportamento do índice do dólar (DXY), ouro e S&P 500; Posicionamento de ETFs institucionais. Deseja receber a análise completa dos níveis técnicos em XAU/USD e os possíveis cenários após o discurso de Powell? 👉 Entre para o Clube ExpertFX e receba nossos relatórios Premium. 📊 Análise técnica + leitura institucional por Igor Pereira, Membro WallStreet NYSE. -
🌍 GUERRA COMERCIAL EUA x EUROPA — Europa deve evitar retaliações contra os EUA, diz Secretário de Comércio O Secretário de Comércio dos Estados Unidos, Daniel Lattnik, afirmou neste domingo (20) que não acredita que a União Europeia adotará medidas de retaliação contra os produtos americanos, mesmo após o prazo de 1º de agosto, quando entra em vigor o novo pacote tarifário imposto por Washington. 📦 Contexto: Tarifas e tensões comerciais Desde que os EUA anunciaram novas tarifas sobre veículos elétricos, aço e produtos agrícolas europeus, aumentaram os temores de uma escalada protecionista entre as duas potências econômicas. Bruxelas prometeu “avaliar medidas apropriadas”, mas ainda não apresentou uma resposta concreta. Nos bastidores, diplomatas europeus demonstram preocupação com os efeitos econômicos de um confronto comercial direto, principalmente em um momento de desaceleração na indústria da Zona do Euro e incertezas geopolíticas globais. 📉 Impacto no mercado financeiro 1. Dólar Americano (DXY): O índice DXY renovou máximas nesta segunda-feira, atingindo o maior patamar desde 23 de junho, impulsionado pela percepção de força econômica dos EUA e menor risco imediato de retaliação comercial. 2. Ouro (XAU/USD): A ausência de retaliações pode gerar alívio nos mercados de risco, o que tende a reduzir temporariamente a demanda por ouro como proteção, especialmente após a forte valorização das últimas semanas. 3. Ações europeias: O euro e os índices acionários europeus podem reagir positivamente à ausência de resposta agressiva por parte da UE, embora o setor automobilístico continue vulnerável. 🔍 O que esperar? Curtíssimo prazo: Diminuição da aversão ao risco e impulso ao dólar, com possível correção no ouro. Médio prazo: Caso a União Europeia opte por não retaliar, isso pode ser lido como sinal de fraqueza diplomática, especialmente diante de um governo Trump mais agressivo no comércio internacional. Atenção do mercado: Continuidade das falas de autoridades europeias nesta semana. Qualquer indicativo de retaliação ainda pode mudar o cenário abruptamente. 🧠 Análise do analista Igor Pereira – ExpertFX School A fala do secretário Lattnik busca gerar estabilidade em um momento de tensão política entre Washington e Bruxelas. No entanto, a ausência de retaliação pode refletir o temor europeu de agravar a recessão industrial já em curso. Para o trader institucional, o foco deve estar em pares como EUR/USD, que pode seguir pressionado, e no XAU/USD, que pode corrigir antes de retomar tendência altista.
-
House Passes Major Bills During ‘Crypto Week,’ But Significant Changes May Take Time
um tópico no fórum postou Redator Radar do Mercado
Despite the excitement surrounding what President Donald Trump has dubbed “Crypto Week,” experts caution against premature celebrations in the cryptocurrency space. The House of Representatives recently passed three significant bills aimed at regulating digital assets, marking a pivotal moment for the industry. However, these legislative changes are not expected to take effect for quite some time. Three Key Crypto Bills Passed The three bills—the Genius Act, the Digital Asset Market Clarity Act, and the Anti-CBDC Surveillance State Act—are seen as crucial steps toward establishing a regulatory framework for cryptocurrencies. This development has been fueled by intense lobbying efforts from industry players like Coinbase Global, which have successfully influenced politicians, including Trump. In anticipation of this legislative week, Bitcoin prices soared to record highs beyond the $123,000 mark for the first time, alongside significant gains for other cryptocurrencies like Ethereum (ETH) and XRP. However, TD Securities analyst Jaret Seiberg notes that it could take over a year for the new legislation to come into effect. Among the passed bills, only the Genius Act has also cleared the Senate, and Trump signed it into law shortly thereafter. This act establishes a framework for regulating payment stablecoins requiring issuers to maintain one-to-one reserves in US dollars or Treasury securities. Treasury Secretary Scott Bessent has argued that this law could generate an additional $3.7 trillion demand for T-bills, although some analysts, like Raymond James’ Ed Mills, express skepticism about such projections. Implementation Timeline Remains Uncertain Despite the signing of the Genius Act, there will be no immediate impacts on stablecoin issuers such as Circle Internet Group or Tether. As reported by ABC news, the Treasury Department is expected to draft rules within a year detailing the qualifications for issuing stablecoins and the conditions under which foreign-pegged stablecoins can enter the US market. This process will involve public commentary and could lead to litigation, suggesting a lengthy timeline before any real changes are felt in the industry. The Digital Asset Market Clarity Act, on the other hand, is particularly important as it delineates the regulatory oversight of crypto exchanges, brokers, and tokens between the Commodity Futures Trading Commission (CFTC) and the Securities and Exchange Commission (SEC). With bipartisan support in the House, there is optimism that the Senate will pass its version before the upcoming August recess, potentially delivering a unified law for the president’s signature by September. The Anti-CBDC Surveillance State Act, the third piece of legislation, aims to prevent the Federal Reserve from issuing a central bank digital currency (CBDC). This bill, which passed with narrower margins, was attached to a national defense bill, and its future in the Senate will likely involve protracted negotiations, possibly extending until December. Featured image from DALL-E, chart from TradingView.com - Yesterday
-
Litecoin Price Crosses $110 Level After 20% Rally — What’s Next For LTC?
um tópico no fórum postou Redator Radar do Mercado
The Litecoin price has been on an impressive run over the last few weeks, mirroring the improving climate of the altcoin market in that period. In the past week, the LTC token put out a strong bullish display, returning above the psychological $100 mark for the first time since mid-May. The Litecoin price has not stopped at the breach of the $100 level, climbing above the $110 mark on Saturday, July 19, to cap off an exhilarating week. Interestingly, the price of LTC seems to only be at the beginning of an extended rally, as pointed out on X by an expert crypto trader. Is LTC About To Witness A 900% Surge? In a recent post on the X platform, Chartered Market Technician (CMT) Tony Severino painted an excitingly bullish picture for the Litecoin price even after its recent market exploits. According to the crypto expert, the price of LTC is on the verge of a bullish breakout that could decide its trajectory over the next few months. This bullish projection is based on a multi-year contracting (or symmetrical) triangle pattern on the Litecoin 2-week chart. The contracting triangle is a pattern in technical price analysis marked by a falling upper boundary (connecting a series of lower highs) and a rising lower trendline (connecting a series of higher lows). In a symmetrical triangle pattern, the asset price continuously contracts and moves toward the apex. Eventually, the price will breach the upper trendline for a breakout or breach the lower trendline for a breakdown. This chart formation could be a continuation or reversal pattern depending on the break’s direction (breakout or breakdown) and the initial trend direction. However, symmetrical triangles are often continuation patterns, meaning the price tends to break in the initial trend direction before it fell into the triangle pattern. So, if history is anything to go by, the Litecoin price is likely to continue its upward trend after it breaks out of the current setup. As Severino pointed out, the Litecoin price is preparing to break out of this multi-year symmetrical triangle and could be on track to break above its current all-time high of $410. In a contracting triangle formation, the price target is determined by adding the length of the widest point of the triangle (or base) to the breakout point. Going by this logic, the price of Litecoin could be on the verge of an over 900% surge over the next few months. Litecoin Price At A Glance As of this writing, the price of LTC sits at around $112.5, reflecting a nearly 11% gain in the past 24 hours. -
Tezos Crypto: The Latest Dinosaur Coin To Pump After XRP Hits New All-Time High
um tópico no fórum postou Redator Radar do Mercado
Historically, one indicator of an upcoming bull run is when “dino” coins start to surge in value. Recently, XRP has led the way, reaching a new all-time high (ATH) of $3.65 on July 16. Now, Tezos has emerged as the latest OG dino coin to make waves, experiencing an increase of over 55% in just 24 hours. While ETH continues to inch slowly upward toward $4,000 and Bitcoin sits comfortably under $120,000 following its significant run, OG coins such as Ripple (XRP), Tezos (XTZ), and Litecoin (LTC) are all making big moves. (SOURCE) XTZ Surges Back Over $1 As Tezos Crypto Is The Latest OG Coin To Pump Tezos crypto, a token that has been around since 2018, experienced an overnight surge, with a +40% pump that has taken the OG coin back over $1 for only the second time this year. It is an often-forgotten OG cryptocurrency, a Layer-1 protocol that was once a top 10 token by market cap, back in February 2020. At that time, there were significantly fewer digital assets on the market, and XTZ was a relatively new and hyped project. Remarkably, the daily trading volume for XTZ has exceeded $1.2 billion, equalling the Tezos cryptocurrency market cap, highlighting the demand for OG coins at present. Even with its latest price increase, Tezos crypto is now only the 101st largest token by market capitalization, a significant decline from its once prominent position among the likes of Bitcoin, Ethereum, Litecoin, and EOS. In reclaiming $1, XTZ has also reclaimed its coveted $1 billion market cap status, and any further move from here will likely place it back into the top 100 cryptocurrencies. Tezos crypto is currently facing significant resistance between $1.15 and $1.20; however, if it manages to break through this level, it could easily rally towards $3. Due to its longevity and time at the top, XTZ is available on all major exchanges, including Binance, Coinbase, OXK, ByBit, and many more. It is a contributing factor to the 800% increase in trading volume experienced by Tezos, as it is widely available on exchanges worldwide. DISCOVER: Top 20 Crypto to Buy in July 2025 Dinosaur Coins Pumping Across The Board As LTC And XRP Also Hit New Heights Over the years, Ripple has continued to develop its platform and attract new investments. The latest fuel for the XRP moon mission is its RLUSD stablecoin, a USD-backed stablecoin that has amassed a $500 million market cap since its launch in December 2024. This growth is expected to lead to the potential listing of an XRP exchange-traded fund (ETF) later this year. Bloomberg analysts estimate a 90% chance that an XRP ETF will be approved in 2025. All of Ripple’s growth over the past year has been driven by a settlement of the longstanding legal dispute between XRP and the US Securities and Exchange Commission (SEC). Official confirmation is expected to be made later this month, which should finally resolve the nearly five-year case between Ripple and the SEC. EXPLORE: 10 Best AI Crypto Coins to Invest in 2025 Join The 99Bitcoins News Discord Here For The Latest Market Updates The post Tezos Crypto: The Latest Dinosaur Coin To Pump After XRP Hits New All-Time High appeared first on 99Bitcoins. -
Bitcoin Won’t Save You—Peter Schiff Says Gold Will Win As Trump Wrecks The Dollar
um tópico no fórum postou Redator Radar do Mercado
Gold proponent Peter Schiff hit out at US President Donald Trump’s support for cryptocurrency, calling Bitcoin a “decentralized Ponzi scheme” wrapped in the American flag. He warned that pushing digital assets at home could erode trust in the dollar. Schiff said that, while some may cheer weaker paper money, it will be gold that wins when Bitcoin finally stumbles. Dollar Confidence In Question According To Schiff, encouraging domestic investment in Bitcoin and crypto “undermines the US economy and speeds up the dollar’s collapse.” He argued that millions of Americans buying digital tokens won’t prop up the world’s main reserve currency. Schiff believes real damage comes when retail investors swap dollars for speculative coins, tipping the scales against greenbacks in global markets. Ponzi Scheme Allegations Schiff described recent cryptocurrency bills as little more than a way to “cloak Bitcoin—nothing more than a decentralized Ponzi scheme—in the trappings of legitimacy.” He claimed insiders use new laws to drive prices up, then get out at higher levels. “The industry is using them to hype Bitcoin and other cryptos so insiders can cash out at higher prices. It’s a legislative low point,” he wrote on X. Stablecoins Under Scrutiny Based on reports, Schiff sees stablecoin plans as a false promise for dollar dominance. He pointed out that a stablecoin backed by any fiat currency offers no real edge. That stability, he warned, will soon give way. He also pointed out tht dollar‑backed coins are only as stable as the underlying money. Echoes Of Tulip Mania Invoking Charles Mackay’s 1630s tale, Schiff compared the digital token craze to the Dutch tulip bubble. He quoted Mackay: “They go mad in herds, and only recover their senses slowly, and one by one.” In that era, bulb prices soared before crashing overnight. Schiff said swapping tulips for Bitcoin makes the same point. Gold Set To Benefit Schiff predicted that, even if Bitcoin supporters toast short‑term dollar weakness, gold will be the real winner. He said that shaky digital schemes will collapse at some point, just as tulip contracts became worthless. When that happens, he expects gold prices to climb. Featured image from Pexels, chart from TradingView