

Todas Atividades
Atualizada automaticamente
- Recentemente
-
 🚨 CZ (Binance) Prevê Novo Ciclo de Alta Exponencial do Bitcoin: "O Atual Topo Será Apenas um Ponto no Gráfico Futuro" Por Igor Pereira – Analista de Mercado Financeiro e Membro Junior WallStreet NYSE ExpertFX School – Julho de 2025 O fundador e CEO da Binance, Changpeng Zhao (CZ), voltou a gerar repercussão no mercado cripto ao afirmar que, apesar do atual recorde histórico do Bitcoin acima de US$ 121 mil, o preço atual será visto no futuro como apenas uma “pequena parte” do verdadeiro potencial de valorização do ativo. A declaração ocorre em meio a um ambiente macroeconômico de rápida transformação: o dólar dos EUA em queda, juros em alta, déficits fiscais disparando e uma institucionalização crescente dos criptoativos. 🌍 Contexto Macro: Crise Fiscal e Perda de Confiança no Dólar A fala de CZ reforça uma visão que vem sendo cada vez mais adotada por gestores e fundos institucionais: o Bitcoin não é mais apenas uma aposta especulativa — é um ativo de proteção contra a desvalorização monetária, especialmente num cenário onde: O índice do dólar (DXY) já acumula queda de -11% em 2025; O pacote fiscal de Trump ("Big Beautiful Bill") eleva os déficits a níveis históricos; O ETF de Bitcoin ($IBIT) já atinge US$ 76 bilhões em ativos sob gestão, superando marcos que levaram décadas para serem atingidos por ETFs tradicionais de commodities. Esse movimento representa uma migração silenciosa de capital institucional para ativos escassos e resistentes à censura, como o BTC. 📊 Perspectiva Técnica e de Longo Prazo Embora o **BTC/USD tenha rompido recordes recentes e esteja cotado a US$ 121.199,70, a fala de CZ antecipa um cenário onde novos patamares como US$ 200 mil, US$ 250 mil ou até US$ 500 mil possam se tornar realidade no médio/longo prazo, conforme os fundamentos se alinham: Emissão limitada a 21 milhões de moedas; Crescimento da demanda institucional (fundos, bancos, family offices); Risco de ruptura na política monetária tradicional (Fed pressionado por Trump); Crescente desdolarização global liderada por países como China, Rússia e Irã. 🪙 Oportunidade ou Euforia? Embora o discurso de CZ possa parecer otimista demais para alguns analistas tradicionais, o contexto atual justifica uma reprecificação estrutural do Bitcoin, especialmente se considerado como: Reserva digital de valor (Digital Gold); Hedge contra inflação e contra política monetária intervencionista; Alternativa legítima ao sistema financeiro tradicional. ⚖️ Impactos no Mercado Bitcoin (BTC/USD): Fortalece a expectativa de alta estrutural, com projeções de continuidade da tendência em direção aos US$ 130.000–140.000 no curto/médio prazo. Altcoins: Tendência de seletividade. Com o ciclo sendo liderado por Bitcoin, altcoins devem sofrer bifurcação — apenas projetos sólidos devem acompanhar o rally. XAU/USD (Ouro): Apesar da concorrência com o Bitcoin, o ouro segue como porto seguro institucional, especialmente diante de riscos geopolíticos crescentes. DXY (Índice do Dólar): A tendência de enfraquecimento do dólar pode intensificar a migração de reservas para ativos reais — BTC incluso. 🔍 Conclusão do Analista A declaração de CZ não deve ser interpretada apenas como otimismo de um entusiasta do setor. Trata-se de uma visão alinhada com dados macroeconômicos, fluxo institucional e desconfiança crescente no sistema fiduciário tradicional. Créditos: Igor Pereira – Analista de Mercado Financeiro e Membro Junior WallStreet NYSE ExpertFX School – Julho de 2025
 - Hoje
-
 Major US stock indices extended their losses from last Friday into today’s Asian session. Both S&P 500 and Nasdaq 100 E-mini futures dropped by 0.5% at the time of writing, weighed down by renewed tariff anxieties. US President Trump issued a surprise escalation, threatening the European Union with a 30% tariff—an increase from April’s proposed 20%, if no improved trade terms are reached before the 1 August deadline. This move follows a series of aggressive tariff demand letters sent to US trading partners over the past week. Hopes for a preliminary US-EU trade deal were dashed after recent media reports hinted at progress, only for negotiations to hit fresh roadblocks. Germany’s DAX reflected this disappointment with a second straight loss of 0.8% last Friday. close Fig 2: Gold (XAU/USD) minor trend as of 14 July 2025 (Source: TradingView) Fig 2: Gold (XAU/USD) minor trend as of 14 July 2025 (Source: TradingView) Recent price actions of Gold (XAU/USD) have managed to retest and stage a rebound from its medium-term ascending trendline in place since the 31 December 2024 low. It has formed a minor “Double Bottom” bullish reversal configuration, taking into account the two swing lows of 30 June and 9 July. Right now, Gold (XAU/USD) is breaking above the US$3,360 intermediate neckline resistance of the minor “Double Bottom” configuration (see Fig 2) In addition, the hourly RSI momentum indicator has continued to flash a bullish momentum condition. Watch the US$3,328 key short-term pivotal support (also the 50-day moving average) for the next intermediate resistances to come in at US$3,400 and US$3,450 in the first step. On the other hand, a break below US$3,328 negates the bullish tone for another choppy minor corrective decline sequence to expose the next intermediate support at US$3,293/3,282. Opinions are the authors'; not necessarily that of OANDA Business Information & Services, Inc. or any of its affiliates, subsidiaries, officers or directors. The provided publication is for informational and educational purposes only. If you would like to reproduce or redistribute any of the content found on MarketPulse, an award winning forex, commodities and global indices analysis and news site service produced by OANDA Business Information & Services, Inc., please refer to the MarketPulse Terms of Use. Visit https://www.marketpulse.com/ to find out more about the beat of the global markets. © {CURRENT_YEAR} OANDA Business Information & Services Inc.
 -
The Bitcoin Liquidity Supercycle Has Just Begun, Says Hedge Fund CEO
um tópico no fórum postou Redator Radar do Mercado
Bitcoin punched through a fresh record above $122,000 on the morning of 14 July, extending its month-long rally to more than 16 percent. Against that backdrop, Charles Edwards—the founder and chief executive of digital-asset hedge fund Capriole Investments—argues that the market is only “in the early stages” of a much broader liquidity-driven boom that could dominate the rest of 2025 and beyond. The Bitcoin Liquidity Supercycle In the latest Capriole newsletter, Edwards contends that “money and liquidity provided the backdrop for capital flows, and Bitcoin Treasury Companies are the funnel.” He dismisses the idea that the past fortnight’s $20,000 advance was a technical accident, pointing instead to deep macro currents that have been building for months. “The biggest Bitcoin rallies occur when the market is net short the USD,” he writes, pointing to Capriole’s proprietary “USD Positioning” gauge, which aggregates futures data across major currencies. The metric has been “deeply negative” since early summer, signalling that global investors are decisively betting against the dollar and in favour of hard assets. Another pillar is credit. BBB-rated corporate-bond spreads have been grinding tighter since the spring, a classic risk-on signal in traditional markets that, since 2020, has mapped almost tick-for-tick onto major Bitcoin up-moves. “More evidence,” Edwards notes, “that Bitcoin is a tradfi asset.” Perhaps the strongest tail-wind, however, is raw money growth. Global M3 has been expanding at an annualised nine percent clip—an historically extreme rate that Capriole says last coincided with average 12-month Bitcoin returns of roughly 460 percent. Edwards cautions that, as a multi-trillion-dollar asset today, Bitcoin is unlikely to repeat that magnitude, “but it wouldn’t be surprising to see something very substantial from here.” Capriole’s framework also draws on an historical lead-lag relationship between gold and Bitcoin. When bullion enters a meaningful breakout, Bitcoin has tended to follow three to four months later. Gold’s early-2025 surge—and its outperformance versus global equities—therefore offered “strong support for the current market’s diminishing demand for fiat money and favour of hard money,” Edwards argues. Since Capriole flagged gold’s move in April, Bitcoin has risen 28 percent. Equities, too, are offering green lights. The New York Stock Exchange advance–decline line broke to new highs last week, while Capriole’s “Equity Premium” indicator reset to zero in late May—both historically consistent with multi-month stretches of expanding risk appetite. All of those data points feed into the firm’s flagship Bitcoin Macro Index, a composite of dozens of public and proprietary variables that Capriole uses to shape trading exposures in its fund. The index “is still in strong positive growth territory,” Edwards reports, even after the coin’s latest vertical move. That suggests the underlying drivers—liquidity, risk sentiment and on-chain activity—“remain intact.” The Bitcoin Treasury-Company Flywheel Yet perhaps the most striking piece of the puzzle lies outside pure macro. Edwards highlights the emergence of Bitcoin Treasury Companies (TCs)—corporate vehicles that raise fiat capital in equity or debt markets and then deploy it into spot BTC—as the new “primary bubble dynamic of this cycle.” Quarterly inflows into TCs reached $15 billion in Q2, and Capriole counts at least 145 such firms now pursuing the strategy. With their market capitalisations inflated by paper gains on balance-sheet coins, they can tap ever-larger funding rounds—a reflexive loop that Edwards believes “will likely help add over $1 trillion to Bitcoin’s market cap over the next year.” He rejects the notion that this amounts to unhealthy centralisation: “If Bitcoin is to one day become base money, it needs to scale to tens of trillions to flatten volatility. The only way that happens is mass acquisition like we are seeing today.” Edwards stresses that his analysis sits on a months-long horizon. “When Bitcoin sees huge rallies there are always strong pullbacks and local overheating,” he concedes, adding that the newsletter deliberately sidelines short-term on-chain froth to focus on the “bigger picture and driving factors for the next six months.” Still, with central-bank liquidity abundant, the dollar crowded short, credit stress muted and a structurally new pool of corporate buyers stepping in, Capriole’s conclusion is unambiguous: the liquidity tap is wide open, and the Bitcoin supercycle it feeds has only just begun. “While today’s early adopters may be seen as speculators, it will be very obvious in hindsight. After the Treasury company wave is the Government treasury wave (next cycle). We are simply riding the adoption curve which requires trillions of dollars to flow in to Bitcoin from the entities that have it in order to achieve scale,” Edwards concludes. At press time, BTC traded at $122,438. -
Bitcoin Price Hits $120K Milestone — Bulls Make History Again
um tópico no fórum postou Redator Radar do Mercado
Bitcoin price started a fresh increase above the $116,500 zone. BTC is now up over 2%, traded to a new high, and might extend gains above the $122,000 level. Bitcoin started a fresh increase above the $118,500 zone. The price is trading above $118,500 and the 100 hourly Simple moving average. There is a bullish trend line forming with support at $119,000 on the hourly chart of the BTC/USD pair (data feed from Kraken). The pair could continue to rise if it clears the $122,000 resistance zone. Bitcoin Price Sets New ATH Bitcoin price started a fresh increase after it cleared the $115,500 resistance zone. BTC gained pace for a move above the $116,000 and $118,500 resistance. The bulls even pumped the pair above the $120,000 resistance zone. A new all-time high was formed at $122,550 and the price is now consolidating gains above the 23.6% Fib retracement level of the upward move from the $116,679 swing low to the $122,550 high. Bitcoin is now trading above $120,000 and the 100 hourly Simple moving average. There is also a bullish trend line forming with support at $119,000 on the hourly chart of the BTC/USD pair. Immediate resistance on the upside is near the $122,550 level. The first key resistance is near the $1123,500 level. The next resistance could be $124,000. A close above the $124,000 resistance might send the price further higher. In the stated case, the price could rise and test the $128,000 resistance level. Any more gains might send the price toward the $128,800 level. The main target could be $130,000. Downside Correction In BTC? If Bitcoin fails to rise above the $122,500 resistance zone, it could start a downside correction. Immediate support is near the $121,500 level. The first major support is near the $119,500 level or the 50% Fib retracement level of the upward move from the $116,679 swing low to the $122,550 high. The next support is now near the $119,000 zone. Any more losses might send the price toward the $118,500 support in the near term. The main support sits at $116,500, below which BTC might continue to move down. Technical indicators: Hourly MACD – The MACD is now gaining pace in the bullish zone. Hourly RSI (Relative Strength Index) – The RSI for BTC/USD is now above the 50 level. Major Support Levels – $122,500, followed by $125,000. Major Resistance Levels – $121,500 and $119,000. -
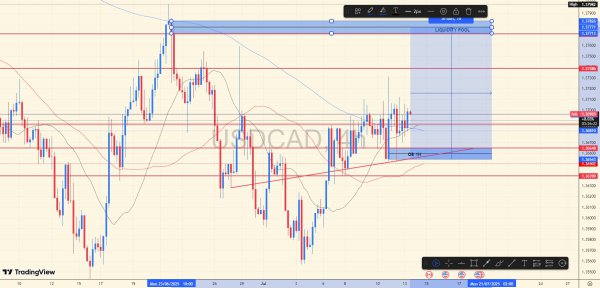 Perspectiva de análise RETEST OB 1H sobre rejeição 1x1H spring vermelho, retorno com AR acima de 1.36765 e continuação para o POOL de LIQUIDEZ. Stoploss não deve ser maior que o último spring 4H vermelho abaixo da OB 1H.
 -
Bitcoin Price Crash Possible As Correction Sentiment Takes Hold — $110,000 Next?
um tópico no fórum postou Redator Radar do Mercado
After hitting a new all-time high of $121,400, the Bitcoin price has started consolidating once again, although the support continues to hold. This is not out of the ordinary, as pullbacks after a major rally are quite common and could be the cool-off needed the uptrend to continue. However, while the $117,000 support has held nicely, it is possible that a deeper correction could be in the cards for the cryptocurrency before the price takes off again. Why A Bitcoin Price Crash Could Begin With the hit to new all-time highs, the weekend brought a slowdown, and this could drive the next wave of correction. Crypto analyst TehThomas explains this in a TradingView post that suggests that there is still the possibility of a short-term correction for the Bitcoin price. However, it could go deeper than expected as the price moves to retest newly formed support at $109,000 and $110,000. According to the analyst, the new peaks have plunged the Bitcoin price into uncharted territory, and there would be a new wave of sells from here. Given this, the analyst advices caution as investors engage with the market and the possibility of a deeper correction arises. Furthermore, there is the formation of an ascending trendline that formed with the horizontal support. Since the trendline moves through the $111,000-$113,000 area, it suggests that the price could fall back downward to retest this level. In the case of a deeper correction, then the analyst sees a price sweep into the $110,000 levels to take out liquidity. However, this sweep would be inherently bullish since the retest would provide a bounce-off point that could lead to a “more sustainable” breakout toward all-time highs. Bullish Prospects Still At Large For BTC While the possibility of a sweep down to former peak levels remains high, it is also possible that the price does not break down and instead continues its upward trajectory. Looking back at the ascending trendline, the analyst points out that it is possible that the price does hold the trendline, reducing the impact of the correction. Such a shallow correction would indicate a continuation without a deeper correction. In this case, the Bitcoin price could resume the uptrend with the $120,000-$125,000 targets in mind. Thus, any deep correction would be expected to begin at much higher price levels. “Bitcoin is currently in price discovery, which means the structure must guide our expectations. A retest of either the trendline or former resistance could provide the next best entry,” TehThomas explained. Regardless of what the case may be, the analyst believes that as long as the price remains above the $110,000 support, then it is inherently bullish. -
🚨 Bitcoin Entra em “Modo Crise”: Nova Alta Histórica Expõe Derretimento do Dólar e Corrida por Ativos Reais Por Igor Pereira – Analista de Mercado Financeiro e Membro Junior WallStreet NYSE ExpertFX School – Julho de 2025 O Bitcoin rompeu todas as métricas tradicionais de comportamento de mercado. Nas últimas sessões, a criptomoeda segue uma trajetória literalmente em linha reta rumo a novos recordes, superando várias máximas históricas no mesmo dia. Em apenas três meses, o mercado cripto adicionou mais de US$ 1 trilhão em valor, enquanto o índice do dólar (DXY) desabou -11% no mesmo período. A principal catalisadora dessa explosão de preço foi a aprovação, em 3 de julho, do chamado “Big Beautiful Bill” pelo Congresso dos EUA — um mega pacote de gastos fiscais proposto pelo presidente Donald Trump, visto como altamente inflacionário e expansivo do ponto de vista monetário. 📈 Alta Exponencial: Bitcoin em Crise... ou em Refúgio? Desde o anúncio do pacote fiscal, o BTC/USD valorizou mais de US$ 15.000, impulsionado por uma tempestade perfeita de fatores macroeconômicos: Alta dos juros nos Treasuries (yields subindo); Dólar em queda livre; Aumento dos preços do ouro (XAU/USD); Recordes de aportes institucionais via ETFs de Bitcoin, como o $IBIT, que atingiu US$ 76 bilhões em ativos sob gestão em menos de 350 dias — o mesmo que o ETF de ouro $GLD levou 15 anos para alcançar. 💸 Divergência Técnica: Bitcoin vs. Dólar Analisando o desempenho YTD (ano a ano), duas datas foram decisivas: 9 de abril: fim da pausa tarifária de 90 dias, com os rendimentos dos Treasuries começando a subir; 1º de julho: aprovação do Big Beautiful Bill. Desde então, Bitcoin, ouro e ações de commodities explodiram, enquanto o dólar mergulhou. A divergência entre DXY e BTC é tão forte que o S&P 500, em termos de Bitcoin, acumula -15% no ano. Desde 2012, o índice perdeu -99,98% de valor frente ao BTC. 🏛️ Investidores Institucionais Não Podem Mais Ignorar o Bitcoin Segundo sondagens de mercado e relatos de fundos, hedge funds, family offices e gestoras tradicionais estão começando a alocar até 1% do AUM (ativos sob gestão) em Bitcoin. Mesmo fundos mais conservadores estão reavaliando o BTC como proteção estrutural diante de: Expansão fiscal descontrolada nos EUA; Política monetária desancorada e manipulada politicamente; Busca por ativos líquidos, escassos e globais. 📌 Bitcoin e Ouro: Dupla de Refúgio em Meio à Crise do Dólar Tanto Bitcoin quanto ouro estão subindo juntos, algo raramente observado em ciclos anteriores. Historicamente, o BTC liderava em períodos de excesso de liquidez, enquanto o ouro reagia a crises geopolíticas. Agora, ambos convergem para o mesmo papel: refúgio contra a deterioração estrutural do dólar. Ativo YTD (2025) Posição atual BTC/USD +153% US$ 121.199,70 XAU/USD +24% US$ 3.360 DXY (USD) -11% 97,60 pts ETF IBIT +140% AUM US$ 76 bilhões 🎯 Conclusão do Analista O Bitcoin entrou oficialmente em "modo crise", não no sentido de colapso, mas como sintoma de que algo estrutural está profundamente errado no sistema monetário global. O mercado está fazendo um ajuste silencioso: hedge contra déficit, contra inflação futura e contra manipulação monetária. Créditos: Igor Pereira – Analista de Mercado Financeiro e Membro Junior WallStreet NYSE ExpertFX School – Julho de 2025
- Yesterday
-
🚨Trump Pressiona por Demissão de Powell: A Nova Frente de Conflito com o Federal Reserve Por Igor Pereira – Analista de Mercado Financeiro e Membro Junior WallStreet NYSE ExpertFX School – 14 de julho de 2025 A relação entre a Casa Branca e o Federal Reserve volta ao centro do cenário político e financeiro global. Segundo declarações do conselheiro econômico Kevin Hassett, o presidente Donald Trump considera demitir o atual presidente do Fed, Jerome Powell, alegando "justa causa" relacionada a excessos nos custos de renovação da sede do banco central em Washington, um projeto estimado em US$ 2,5 bilhões. As declarações abrem um precedente histórico e institucional sem paralelos recentes, reacendendo temores sobre a independência do Fed e ampliando os riscos políticos que afetam diretamente as taxas de juros, o dólar e o mercado de ouro (XAU/USD). 🏛️ O Caso: Custos Exorbitantes e a “Renovação Palaciana” do Fed O pivô da crise institucional envolve uma investigação sobre os custos de renovação da sede do Fed, que subiram de US$ 1,9 bilhão para US$ 2,4 bilhões, segundo relatório do Inspetor-Geral. O projeto foi criticado por membros do governo como “extravagante”, com menções a “jardins no terraço, mármore premium, salas VIP e elevadores especiais” — acusações que o próprio Powell rebateu em audiência no Senado: Apesar disso, Kevin Hassett afirmou em rede nacional que a administração “estuda ativamente” a possibilidade de demissão de Powell com base nesse escândalo orçamentário. Paralelamente, o ex-governador Kevin Warsh — possível substituto de Powell — defendeu no domingo uma “mudança de regime no Fed”, afirmando que o banco central perdeu o rumo tanto na política monetária quanto na supervisão financeira. ⚖️ Trump Pode Demitir Powell? A autoridade para demitir o presidente do Fed é legalmente controversa. Segundo o republicano French Hill, que preside o Comitê de Serviços Financeiros da Câmara, Trump não possui essa autoridade de forma unilateral, embora tenha o poder de indicar sucessores e criticar publicamente a gestão atual: No entanto, Hassett reforçou que “caso se comprove justa causa, a demissão é juridicamente possível”, abrindo caminho para uma potencial batalha constitucional entre os Poderes Executivo e Monetário. 💥 Impacto no Mercado Financeiro 📌 1. Dólar e Treasuries A possibilidade de interferência política direta no Fed pode gerar desconfiança dos investidores institucionais e estrangeiros, pressionando o dólar e provocando volatilidade nos Treasuries de 10 e 30 anos. Caso Powell seja demitido, o mercado poderá precificar uma mudança mais agressiva na trajetória de juros, com risco de afrouxamento monetário sob influência política. 📌 2. XAU/USD (Ouro) O ouro pode ganhar forte tração como ativo de proteção institucional, especialmente diante do aumento da percepção de risco nos EUA. O XAU/USD já superou a média móvel de 50 dias e mira a região dos US$ 3.400 a US$ 3.500, com suporte imediato em US$ 3.310. Um evento como a demissão de Powell pode disparar uma corrida por ouro físico e contratos na Comex. 📌 3. Risco Sistêmico e Confiança A substituição de Powell por um nome alinhado politicamente, como Kevin Warsh, pode desencadear críticas globais sobre a perda de independência do Fed, prejudicando a credibilidade da política monetária americana. Agências de rating e bancos centrais estrangeiros podem reavaliar sua exposição ao dólar e aos ativos norte-americanos, com possível repercussão negativa no fluxo cambial e nos ativos de risco. 📊 O Que Esperar nos Próximos Dias? Fator Expectativa Moeda USD Volatilidade e possível desvalorização no curto prazo XAU/USD Potencial explosivo de alta em caso de ruptura institucional S&P 500 Correção técnica possível diante de incerteza política Volatilidade (VIX) Alta provável se Trump formalizar tentativa de demissão 🎯 Conclusão do Analista A crise entre o governo Trump e o Federal Reserve representa um ponto de inflexão no equilíbrio entre os Poderes nos EUA. A possível demissão de Powell, caso avance, pode abalar as fundações da independência do banco central americano — um dos pilares da confiança global na moeda e nos títulos do Tesouro dos EUA. Créditos: Igor Pereira – Analista de Mercado Financeiro e Membro Junior WallStreet NYSE ExpertFX School – Julho de 2025
-
Ripple’s $21 Trillion Dream: What Capturing 20% Of SWIFT Volume Means For XRP
um tópico no fórum postou Redator Radar do Mercado
Ripple Labs, a crypto payments company, continues to set its ambitions and those of XRP higher than ever as it edges closer to disrupting the global financial messaging giant SWIFT. After Ripple CEO Brad Garlinghouse previously projected that XRP could capture 14% of SWIFT’s volume, new estimates now point to even bolder targets. How Ripple Securing 20% Of SWIFT Could Impact XRP A new report by Paul Barron, a technologist and crypto analyst, has revealed an updated forecast for Ripple. The report highlights XRP’s growing potential to take on SWIFT in cross-border transactions. Ripple’s ambitions in the global financial infrastructure are becoming more tangible, as new projections suggest that XRP could eventually process up to 20% of SWIFT’s transactional volume. Notably, these fresh estimates come just a month after Garlinghouse and the Ripple company predicted a 14% share in SWIFT’s volume within five years. Now, with increasing institutional traction, growing market momentum, and rapid adoption, expectations are rising sharply. SWIFT, the global messaging network used by international banks and financial institutions to securely transmit information and cross-border payment instructions, currently handles $150 trillion in annual transaction volume. Based on this large figure, Barron disclosed that Ripple’s previously predicted 14% transactional volume projection would mean $21 trillion flowing annually through the XRP Ledger (XRPL). While 14% of SWIFT’s volume already represents a significant amount, Ripple now believes that XRP could handle an even greater share of the global cross-border payments market. Based on the same calculations used by Barron, if Ripple were to achieve 20% of SWIFT’s volume, it would translate to approximately $30 trillion in annual value flowing through the XRP Ledger. This projection underscores Ripple’s growing confidence in XRP as a viable alternative to the decades-old SWIFT network. The company has consistently indicated its goals to replace SWIFT, with XRP becoming a central player in transforming the global payments structure. XRP Scaling Potential And Market Implications The vision of XRP processing a significant amount of SWIFT’s volume annually raises major implications for its scalability, long-term utility and valuation. At such a scale, XRP would not merely be a bridge currency for remittance but a pillar in the future of traditional finance and digital currency markets. Ripple’s strategy hinges on overtaking SWIFT’s legacy system, which has long been criticized for its slow settlement times and high costs. The XRPL, with its near-instant settlement and low transaction fees, presents a modern alternative capable of streamlining transactions at scale. This expanding use case could elevate XRP, possibly even driving its current price of $2.78 higher to uncharted levels. If Ripple can execute its projections and secure 20% of SWIFT’s volume, it would mark a turning point not just for the company but for the broader crypto industry. Featured image from Unsplash, chart from TradingView -
OURO DISPARA COM RETORNO DAS TENSÕES COMERCIAIS E VIÉS DOVISH DO FED
um tópico no fórum postou Igor Pereira Análises Fundamental
🟡 OURO DISPARA COM RETORNO DAS TENSÕES COMERCIAIS E VIÉS DOVISH DO FED Por Igor Pereira – Analista de Mercado Financeiro e Membro Junior WallStreet NYSE ExpertFX School – Julho de 2025 O ouro encerrou a semana com forte valorização, saltando quase 1% na sexta-feira (9), em resposta ao aumento das tensões comerciais globais e à expectativa de cortes de juros pelo Federal Reserve. O XAU/USD fechou em US$ 3.355,66, superando a média móvel de 50 dias pela primeira vez em duas semanas – um sinal técnico claro de que o viés altista voltou a ganhar força. 💡 Fatores Fundamentais: Trump Ativa Nova Onda de Tarifas O catalisador principal desse movimento foi o anúncio de uma nova rodada de tarifas comerciais por Donald Trump. O ex-presidente e atual mandatário impôs: 35% de tarifa sobre importações do Canadá; 50% sobre produtos brasileiros, incluindo metais industriais como cobre e alumínio; E sugeriu tarifas generalizadas de 15% a 20% sobre a maioria dos parceiros comerciais dos EUA. Essa política agressiva reacendeu o temor de uma nova guerra comercial global, provocando fuga para ativos de proteção como ouro e prata — esta última, inclusive, atingiu o maior patamar em 13 anos. 🏦 FED: Sinais Dovish Reforçam o Cenário Altista Além das tensões comerciais, o mercado foi impulsionado por declarações dovish do governador Christopher Waller, do Federal Reserve, que reforçou a possibilidade de dois cortes de juros até o final de 2025. Apesar dos juros dos Treasuries terem subido levemente (com o título de 10 anos em 4,417% e o de 30 anos em 4,955%), os rendimentos reais continuam baixos, favorecendo ativos que não oferecem yield, como o ouro. O dólar americano teve leve valorização, mas seu potencial de alta permanece limitado diante do cenário de flexibilização monetária e aumento das incertezas políticas e comerciais. 📊 Análise Técnica: XAU/USD Retoma Força Acima da Média de 50 Dias Do ponto de vista técnico, o XAU/USD mostra um padrão claro de reversão altista, com os seguintes destaques: Indicador Situação Atual Fechamento Spot US$ 3.355,66 Média Móvel 50 dias (SMA50) Superada (US$ 3.325,80), sugerindo retomada da força compradora Suportes importantes US$ 3.282 e US$ 3.244 Resistência imediata US$ 3.378 Alvos superiores US$ 3.451 e US$ 3.500 (alvo psicológico e técnico relevante) Enquanto o preço se mantiver acima da SMA50, o viés técnico permanece positivo, com compradores assumindo controle do curto prazo. 🎯 O Que Esperar para o Ouro (XAU/USD)? 🔺 Cenário Altista Continuidade nas tensões comerciais pode gerar nova onda de busca por proteção; Caso o Fed sinalize cortes com mais clareza, o ouro tende a romper a resistência em US$ 3.378, abrindo espaço para US$ 3.500. 🔻 Riscos Baixistas Caso o mercado interprete os movimentos de Trump como negociáveis ou simbólicos, a pressão pode diminuir; Caso o dólar se fortaleça abruptamente por fatores técnicos ou fluxos de hedge, o ouro pode perder tração e retornar para suportes em US$ 3.280. 📌 Conclusão do Analista O mercado de ouro volta a ganhar tração, apoiado por uma combinação poderosa de risco geopolítico/comercial e projeções dovish do Fed. A recuperação técnica do XAU/USD acima da média de 50 dias indica que os touros voltaram ao controle. Créditos: Igor Pereira – Analista de Mercado Financeiro e Membro Junior WallStreet NYSE ExpertFX School – Julho de 2025 -
Bitcoin Stalls After Rally: Will It Blast Through $125,000 Or Slip Back To $110K?
um tópico no fórum postou Redator Radar do Mercado
After a powerful breakout last week that pushed Bitcoin into a new all-time high of $118,667, the world’s leading cryptocurrency appears to be taking a breather. As of the time of writing, Bitcoin is trading around $117,953, slightly below its recent peak. The move followed a string of consecutive daily gains as bullish momentum swept across the crypto industry. In a technical analysis shared on the TradingView platform, crypto analyst RLinda pointed out two scenarios that may play out over the coming days and weeks, depending on how Bitcoin reacts to nearby resistance and support levels. Support Zones Could Affect Bitcoin’s Next Big Move RLinda’s technical analysis begins with identifying the significance of Bitcoin’s recent all-time high. Although Bitcoin has entered what seems to be a consolidation phase, there’s no confirmed top just yet. The market structure still favors bullish continuation, especially considering Bitcoin is just coming out of a prolonged two-month consolidation zone and entering a realization phase. According to the 1-hour candlestick price chart, Bitcoin is currently trading just above a support area below $117,500. If Bitcoin fails to hold this zone, the leading cryptocurrency could kick off a cascade of corrections that could drive the price to $115,500, then potentially to $114,300, and even back to the previous all-time high of $111,800. Below that, the 0.5 and 0.705 Fibonacci levels around $113,031 and $111,960 respectively may act as temporary cushions. The last major defensive buy zone is around $110,400, where bulls may step in for a bounce. Basically, what this means is that if Bitcoin loses the support level at $115,500, it could slip back to $110,000 before encountering another strong buy support zone. Image From TradingView: RLinda Bitcoin To $125K, But It Must Breach Resistance First On the other hand, Bitcoin can still push above $118,000 and increase to $125,000, but only under certain conditions. The condition of the rally’s continuation depends primarily on Bitcoin registering a decisive daily close above $118,400 and $118,900. In her words, a daily close above these price levels would hint at a “breakout of structure.” This, in turn, would confirm a transition from consolidation into another impulsive phase upward. In essence, both the bearish and bullish outlooks depend on how Bitcoin reacts at any of the important zones, either support at $116,700 or resistance above $118,400 before making a directional move. However, it is important to note that the consolidation after last week’s rally could last for weeks or even months, much like we’ve seen in previous rallies this cycle. According to the Long-Term Holder Net Unrealized Profit and Loss (NUPL) metric from Glassnode, Bitcoin’s current level of long-term profitability sentiment is at 0.69. This is notably below the 0.75 mark associated with euphoric market conditions, despite Bitcoin having just printed a new all-time high. Image From X: Glassnode Bitcoin spent around 228 days above the 0.75 euphoria threshold in the previous bull market cycle. In contrast, this current cycle has only seen about 30 days above that level, which suggests long-term holders have not yet fully exited into profit and the leading cryptocurrency hasn’t reached overheated conditions. Featured image from Unsplash, chart from TradingView -
Kiyosaki Awaits The Next Bitcoin Sale: ‘My Fellow Pigs And I Are Feasting’
um tópico no fórum postou Redator Radar do Mercado
Robert Kiyosaki, author of “Rich Dad Poor Dad,” stepped back into the Bitcoin market with a bold move. According to his tweet on July 11, he purchased another Bitcoin at $110,000. Based on reports, he’s betting that today’s price will look cheap if Bitcoin ever hits $1 million. His choice puts him in what analyst Raoul Pal calls the “Banana Zone,” where fear of missing out drives latecomers to buy at the top and then suffer losses. Bitcoin Betting At High Prices Kiyosaki used his “PIGs Get Fat. HOGs Get Slaughtered” rule to explain why he bought at such a high level. He plans to hold until less disciplined investors push prices even higher and then sell when they panic. He warned that FOMO is like a disease that spreads fast through crowded markets. In his view, buying now—even if prices seem lofty—is key to making a profit later. His Early Entry And Regrets He first bought Bitcoin at $6,000, a price he admits felt expensive at the time. He said he waited too long to learn about modern money before jumping in. That lesson stuck. He’s open about past mistakes and uses them to guide current moves. He figures that if Bitcoin reaches $1 million, he’ll regret not adding more at $110,000. Learning From Past Mistakes Kiyosaki recognized he “could be wrong and a sucker” after buying another Bitcoin, yet he added that he’d “rather be a sucker than a LOSER if Bitcoin does go to $1 million.” He noted that he can handle a $100,000 loss thanks to his past work and savings. That safety net gives him room to ride out sharp drops—dips of 30–50% happen in crypto all the time. Advice For Small Investors He urged readers to pick up bits of Bitcoin however they can. “Even if you can afford only one Satoshi today, buy it,” he said. A Satoshi is one hundred millionth of a Bitcoin. Based on those remarks, he expects newcomers to look back and wish they’d snapped up every chance to buy. He also told people to “think for yourself” and not follow his words blindly. Kiyosaki’s transparency with regards purchase prices gives his fanbase a clear view of his risk comfort level. The author views each trade as a learning step, not just an opportunity to make fast bucks. By sharing his entry point at $110,000, he sets a real‑world example of how far he’s willing to go in pursuit of that $1 million goal. Featured image from Meta, chart from TradingView -
EURUSD Drill Down Where is it Headed? Analysis and Risk
um tópico no fórum postou Redator Radar do Mercado
Drilling Down to Identify the Strong Side of the Forex Market EURUSD Drill Down Where is it Headed? Analysis and Risk One of the most important decisions in forex trading is identifying the right side of the market to trade. In fact, many traders will tell you that choosing the right side is more than half the battle. If you can consistently position on the strong side of the market, you’re already putting yourself in a better position to succeed. So, how do you find that strong side? The answer lies in a systematic chart analysis method known as “drilling down,” paired with tools like the Amazing Trader charting algorithm. EURUSD Drill Down Where is it Headed? Analysis and Risk What Is the Strong Side of the Market? The “strong side” is the side least likely to see follow-through against it. In other words, it’s the side where there are no nearby key stops to trigger reversals or break momentum. When you identify this side, you increase the odds of catching trades that flow with the market rather than fight it. What Does “Drilling Down” Mean? Drilling down is a top-down technical analysis approach. You start with longer-term charts—such as the monthly—and work your way down through weekly, daily, and intraday timeframes (e.g., 4-hour, 1-hour, 15-minute) to see if price action aligns across all levels. This process helps: • Confirm trends • Spot key support/resistance levels • Distinguish retracements from trend continuations For day traders, this is especially valuable in distinguishing whether a short-term move is just a pullback or a true trend shift. So EURUSD Drill Down Where is it Headed? Analysis and Risk EUR/USD Drill Down Analysis (Live Example) Let’s apply this process to EUR/USD using the Amazing Trader Ladder Strategy and chart pattern analysis. Monthly Chart • Trend: Up • Pattern: 5 consecutive green candles • This month: A red candle would break the pattern • Key Level: 1.1343 (would signal outside month if broken) Takeaway: The monthly chart is not offering much immediate guidance. EURUSD Drill Down Where is it Headed? Analysis and Risk Weekly Chart • Trend: Up • Pattern: 7 green candles in a row (one exception can be ignored) • This Week: The pattern was broken, suggesting risk of retracement or consolidation • Key Level: 1.1065 (still intact) Takeaway: No immediate threat to the trend, but signs of exhaustion…drill down further. EURUSD Drill Down Where is it Headed? Analysis and Risk Daily Chart • Trend: Still up, but currently retracing 2 Patterns to Watch 1) Amazing Trader Ladder Pattern • Falling blue ladder rungs indicate momentum is shifting down • Key Levels: o Below 1.1750 = downside risk persists while below it o Above 1.1750 = risk to the downside is negated o 1.1662 = current support (near double bottom) o Break below 1.1662 → 1.1580 becomes the next target 2) Magic Levels Pattern • 5-day sideways range centered around 1.1700 (i.e. 1.17 has traded 5 days I a row) • This pattern gains strength when prices pivot these key round numbers like 0, 2, 5, 8 • The longer the consolidation, the more powerful the breakout when it happens • Once the pattern is broken, it often signals a directional; move in the direction of the break • Watch closely to see if 1.17 pivot becomes either support or resistance EURUSD Drill Down Where is it Headed? Analysis and Risk 4-Hour Chart • Key Levels: 1.1662 (support), 1.1750 (resistance) • Larger stops likely below 1.1662 = the more vulnerable side • A break of 1.1662 could lead to 1.1580 • If 1.1662 is broken then 1.1714 becomes a key resistance on the AT ladder Let the Market Tell You the Strong Side By using a structured drill-down approach, combined with repeatable patterns like the Amazing Trader ladder (and Magic Levels), traders can spot high-probability setups with greater confidence. If you’re serious about trading with the trend and staying on the strong side, make this process part of your daily preparation. Let the charts align and let the market lead the way. Sign up for an Amazing Trader 30 day free trial special EURUSD Drill Down Where is it Headed? Analysis and Risk Become a Member of Global Traders Association – Click HERE The post EURUSD Drill Down Where is it Headed? Analysis and Risk appeared first on Forex Trading Forum. -
Silver ETF inflows at record pace in 2025 amid surging prices — report
um tópico no fórum postou Redator Radar do Mercado
Silver has emerged as one of the most attractive investment assets of 2025, with funds flowing into exchange-traded products (ETP) backed by the metal already surpassing all of last year, says the Silver Institute. During the first half of 2025, silver-backed ETPs saw net inflows totalling 95 million oz., taking the total global holdings to 1.13 billion oz. — only 7% below the peak level of 1.21 billion oz. in February 2021, according data compiled by the Institute. Boosted by rising silver prices, the total value of ETP holdings hit a series of all-time highs in June, exceeding $40 billion for the first time. Nearly half of the year’s gains were recorded in that month alone, coinciding with silver’s surge to a 13-year high. By month-end, the metal’s price had gone up by a quarter for the year. The Silver Institute notes that June 2025 was the most significant monthly increase since the Reddit-driven silver squeeze in early 2021, when prices leaped to nearly $30 an ounce. Those gains extended into July, with a recent surge that took silver prices briefly above $39 an ounce — the highest in 14 years — and its year-to-date gains to 27%, matching that of gold. Futures trading also demonstrated a strong commitment to silver as a store of value, the Institute says. Data available showed that net long position on the CME was a staggering 163% from the 2024 year-end levels as of June 24, with average net longs at their highest levels since H1 2021. On the retail front, the investment trend varies by region. In Europe, retail investment (in volume terms) still lags behind the elevated levels seen during 2020–2022 despite its recovery over the past year and a half. India, on the other hand, continues to see strong demand, posting a 7% year-over-year gain over the first six months of 2025. This contrasts with the US, where selling back by retail investors remains high. This dynamic, along with weak retail purchases, has weighed heavily on new bar and coin sales, the Silver Institute says. As a result, overall retail demand in the US is estimated to have fallen by at least 30% this year. Looking ahead, in the coin and bar market, the research group sees “potential for strong two-way activity in the months ahead,” though demand for newly struck products may remain subdued. One area of uncertainty, however, is how investors will react should the silver price eclipse $40. “The market could see a mixture of profit-taking by some, while other investors jump in, expecting further price gains,” it says. -
Ethereum Chart Confirms Bull Flag Breakout: $3,834 Target Comes Into View
um tópico no fórum postou Redator Radar do Mercado
Ethereum has finally touched the $3,000 price level once again after spending weeks trading in a narrow range beneath $2,800. This recent breakout, although brief, marks the first time Ethereum reclaimed this level since early February. According to technical analyst Merlijn The Trader, Ethereum’s next destination after breaking past $3,000 is already in sight. Bull Flag Breakout Points To Measured Move For Ethereum Ethereum went through an interesting rally last week alongside Bitcoin’s push to new all-time highs. However, this Ethereum price rally, which saw it touch $3,000 again, wasn’t based on momentum spillover from Bitcoin alone. This is because Ethereum itself experienced significant institutional interest from Spot Ethereum ETFs. According to data from SoSoValue, US-based Spot Ethereum ETFs recorded a combined $907.99 million in inflows last week, their best week since the products launched in July 2024. Thursday, July 10, alone was highlighted by inflows of $383.10 million, making it the largest single-day inflow for any Ethereum ETF in 2025 so far. In a post shared on the social media platform X, crypto analyst Merlijn pointed to a confirmed bull flag breakout on Ethereum’s daily candlestick timeframe chart. Interestingly, the technical setup proposed by the analyst follows a falling wedge reversal that preceded the current uptrend. According to the chart attached to his analysis, the falling wedge that led to the reversal was formed from the December 2024 highs to the April 2025 lows, with the breakout occurring in mid-May. The breakout eventually saw Ethereum entering into a tight flag-like consolidation that spanned between May and June, until the most recent breakout above $2,700. That pattern has now resolved to the upside, and the next technical level of interest is a measured move based on the price action that formed the pole of the bull flag. This measured move places the next technical level of price interest at $3,834. Image From X: Merlijn The Trader 80% Of ETH Now In Profit On-chain indicators further validate Ethereum’s current strength. According to data from on-chain analytics platform Santiment, Ethereum’s price action has been dancing around the $3,000 mark since Friday, crossing it multiple times intraday. During this back and forth, 124.13 million ETH out of the 155.04 million total supply crossed into profitability, which represents 79.96% of all tokens. This reading is particularly interesting as it is the highest percentage recorded since January 2025. Image From X: Santiment The same data shows Ethereum is just 13 million coins away from matching the total supply in profit at its previous all-time high of profitability recorded in December 2024. This shift toward a profit-heavy network state tends to encourage holding behavior and long-term conviction, which could translate into reduced sell pressure in the coming week. This, in turn, could see Ethereum close a daily candle above $3,000 and move toward the $3,834 price target during the new week. At the time of writing, Ethereum is trading at $2,960, up by 17.5% in the past 24 hours. Featured image from Unsplash, chart from TradingView -
Ethereum Breaks Critical $2,800 Level — Can Bulls Hold For Major Rally?
um tópico no fórum postou Redator Radar do Mercado
Popular market analyst with X username Daan Crypto has provided an important insight into the Ethereum market, stating the altcoin finds itself in a delicate price situation. Notably, Ethereum (ETH) prices crossed above $2,800, a critical resistance level, before briefly touching the $3,000 zone. During this period, the second-largest cryptocurrency registered market gains of 16.77% to produce a remarkable price performance. Bulls Eye $4,000 As Long-Term Range Breakout Holds In an X post on July 12, Daan Crypto explains that $2,800 has acted as a long-standing resistance capping Ethereum price action on both sides over the past two years. Following recent bullish fortune, the prominent altcoin decisively broke through this price barrier, signaling intent for further price gains. However, the price retracement from $3,000 suggests the bulls are facing immediate profit-taking pressure that may force a return below $2,800. According to Daan Crypto, while a quick price dip and buy-back up may not harm current bullish sentiments, a stalled price action under $2,800 may force ETH to revisit lower levels around $2,100-$2,160. The analyst highlights that ETH bulls maintaining a price point above $2,800 is critical to sustaining the present bullish structure, paving the way for a price return to the market cycle peak at $4,000. From a risk/reward perspective, this level now offers traders a clear invalidation point that market bulls remain in control as long as ETH stays above $2,800. Interestingly, the Moving Average Convergence Divergence (MACD) indicator on the ETH daily chart backs the potential of a sustained price uptrend. This is because the MACD line recently crossed above the signal line, which is largely interpreted as a bullish signal. However, it’s worth noting that the Relative Strength Index (RSI) is valued at 71.12, in the overbought zone. This report suggests Ethereum holds strong potential of becoming an overheated market, resulting in a wide spread distribution. Ethereum Market Overview At the time of writing, Ethereum trades at $2,966 on the daily chart, reflecting a 0.11% decline in the past day. Despite the minor pullback, the asset has posted an impressive 16.53% gain over the past month, indicating that the majority of investors remain in profit. According to data from blockchain analytics firm Sentora, the Ethereum network recorded total network fees of $6.04 million, representing a modest 0.60% drop compared to the previous week. This slight decline in fees points to a small reduction in transaction activity on the network. Meanwhile, crypto exchanges registered outflows of $493 million, suggesting investors are opting to keep their assets in private wallets. Such behavior typically reflects growing confidence in the market, as users are less inclined to sell and more likely to hold in anticipation of continued price appreciation. -
SCP sees West Africa explorers nearing ‘sweet spot’
um tópico no fórum postou Redator Radar do Mercado
New West African gold explorers are advancing projects as they aim to capitalize on high prices and growing interest from mid-tier producers, SCP Resource Finance says in a new report. Published Friday, the report spotlights Turaco Gold (ASX: TCG) as a standout among emerging Africa-focused developers. Its flagship Afema project in southeast Côte d’Ivoire hosts a 3.6-million-oz. resource and could support a 200,000-oz.-per-year operation within three years, SCP says. Afema could grow to as many as 5 million oz., giving it a net present value of $1.59 billion, based on a gold price of $3,000 per ounce. “Turaco has firmly established Afema as one of the next generation of West African mine builds with potential to permit and complete the definitive feasibility study by the second half of 2026,” research head Justin Chan and his colleagues wrote. “We think Afema will be a mine.” A long-standing hotspot for gold mining, West Africa has seen more than 70 million oz. of new gold discoveries over the past 15 years — outpacing Canada, the US and Australia, according to S&P Market Intelligence data — despite significantly lower exploration spending. Key structural advantages include prolific geology, fast permitting timelines and year-round exploration access, SCP says. Turaco’s Afema is the most advanced asset. The company already holds a mining licence and has road and grid power access within 120 km of Abidjan, Côte d’Ivoire’s economic capital. Track record Turaco’s executive team, led by managing director Justin Tremain, has a track record of selling West African assets to major producers. SCP estimates a 10-year mine life for Afema, producing 200,000 oz. per year at an all-in sustaining cost of $1,422 per ounce. At a $3,000 gold price, the project would generate a 67% post-tax internal rate of return, SCP calculates. The report also highlights a clutch of early-stage explorers making high-grade discoveries across the region. They include Sanu Gold (TSXV: SANU) in Guinea and Aurum Resources (ASX: AUE), Awalé Resources (TSXV: ARIC), Many Peaks (ASX: MPK), Kobo Resources (TSXV: KRI) and African Gold (ASX: A1G) in Côte d’Ivoire. All are actively drilling in regions with established infrastructure and historical production. Projects that can start building in the next two-and-a-half years find themselves in what SCP calls the “sweet spot,” since nearly all Africa-focused producers “will be or are actively looking for projects within this window.” What’s more, nearly all these producers have built mines recently, “thus are not afraid of a buy and build,” SCP adds. Possible buyers Likely acquirers of the next generation of build-ready projects include producers such as Perseus Mining (ASX, TSX: PRU), Allied Gold (TSX, NYSE: AAUC), West African Resources (ASX; WAF), Montage Gold (TSX: MAU) and Robex Resources (TSX: RBX; ASX: RXR), SCP says. Montage already owns 19.9% of Sanu, while Perseus, Allied and West African Resources are seeking near-term acquisitions to replace reserves or expand beyond politically riskier jurisdictions such as Burkina Faso, the analysts wrote. Sanu is attracting attention after early drill intercepts at its Daina project in Guinea, including 51 metres at 3.1 grams gold per tonne near surface. In Côte d’Ivoire, Aurum and Many Peaks are targeting large-scale systems with multi-rig campaigns. Kobo’s flagship Kossou project, located just 6 km from Perseus’s Yaouré mine, is advancing towards an initial resource estimate following recent intercepts such as 20 metres at 1.9 grams gold. Although African gold companies can be stigmatized or avoided by some investors, “we think the opportunities are too compelling to ignore,” the SCP analysts wrote. “Africa is not easy to operate in, but the silver lining is we see very few lifestyle companies in West Africa; management teams want to make a discovery and build or get acquired as soon as possible and tend to move on quickly from subscale assets.” With gold consolidating above $3,000 per oz., risk capital available for high quality management teams and a competitive M&A environment for build-ready projects, SCP says “the window is wide open for West African gold explorers.” -
Solana (SOL) Set For Price Run To $2,700 — But This Condition Must Hold
um tópico no fórum postou Redator Radar do Mercado
Solana (SOL) has registered a 0.58% loss in the past day, representing a slight price retracement from its strong weekly performance. Notably, the altcoin gained by nearly 10% in the last seven days as general crypto prices surged, pushing its unit price into the $160 price region. Amidst the present market cool-off, Ali Martinez has tipped Solana to embark on a parabolic rally subject to a particular market condition. Solana Bulls Eye Breakout As $170 Emerges As Critical Resistance In an X post on July 12, Martinez outlines a bullish technical analysis on the Solana market, stating the altcoin is at a key price juncture. Using the weekly chart, the analyst has been able to identify a mega cup-and-handle pattern, which usually precedes a major price rally. However, the altcoin faces a critical price resistance at the $170 region. For context, the cup-and-handle pattern is a popular bullish chart formation that indicates potential for significant price upswings. As seen in the chart below, it resembles the shape of a teacup, commencing with a bearish market, followed by a price recovery of equal magnitude as seen between the start of 2022 and the start of 2025. During this period, investors saw Solana prices crash from around $250 to a cycle low of $9.88 before experiencing a gradual return to a similar peak, thereby forming the cup pattern. Thereafter, SOL has experienced significant price corrections and rebounds, eventually creating a descending price pattern that represents the handle of this formation. Notably, the cup-and-handle pattern only translates into a price surge following a decisive price breakout above the formation’s neckline. Following recent gains, Solana finds itself within touching distance of this neckline at the $170 price mark. Martinez explains that a successful weekly close above this major resistance will validate the bullish intentions on Solana, inducing a heavy market demand and paving the path for higher price territories. Based on the Fibonacci retracement and extension levels on the chart, the initial price target in the event of this breakout is set at $295, instantly matching the current all-time high. However, the historical magnitude of breakouts from cup-and-handle pattern points to lofty price targets, such as $ $787, $1,314, and a max target of $2,744. However, a rejection at $170 may force Solana to visit lower support levels near $135 or even $100, which has served as a major demand zone in the past. Solana Price Overview At the time of writing, Solana is trading at $162.58 with a decline of around 0.58% as earlier stated. Meanwhile, the asset’s daily trading volume is down by 38.77% and valued at $3.72 billion. -
The Best Gold in the World & Top 10 Gold Producing Countries in 2025
um tópico no fórum postou Redator Radar do Mercado
When discussing the best gold in the world, investors and collectors often look for a combination of purity, consistency, and the reputation of the country or mint behind it. The finest gold typically comes from regions with well-established mining industries, advanced refining technology, and strict quality standards. Among the top sources, countries like Switzerland are known for their exceptional refining processes that produce gold with extremely high purity levels, often reaching 99.99 percent. However, when it comes to actual production, the global stage is led by a different set of powerhouses. In 2025, the top gold producing countries include China, which has held the lead for years due to its large-scale mining operations and government-supported industry. Russia follows closely, leveraging its vast reserves and industrial capabilities to maintain strong output. Australia is another key player, offering both quantity and high-grade gold from its well-managed mines. The United States remains a top contributor, primarily through its mines in Nevada. Other notable countries include Canada, Peru, South Africa, Ghana, Indonesia, and Uzbekistan, all of which play vital roles in the global gold supply chain. These nations vary in output but collectively shape the global pricing and availability of physical gold. For investors seeking the highest quality gold, products from recognized mints like the Royal Canadian Mint, the Perth Mint, or the United States Mint are often preferred due to their global recognition and liquidity. Ultimately, the best gold is not just about where it is found but how it is processed, certified, and presented to the market, making both production and refining standards essential factors to consider. Gold has been considered a valuable commodity for centuries for its beauty and durability and its role as a hedge against inflation and a store of wealth. As a result, gold has become an essential part of many national economies, with some countries being major producers of this precious metal. However, not all gold is created equal, with some countries producing gold that is considered higher quality than others. This article will explore the best gold in the world and the top 10 gold-producing countries. Is the gold price the same in all countries? The price of gold is determined by its demand and supply in the market, and it varies from country to country. The London Gold Fixing sets the global gold price, which is a process that takes place twice a day and involves representatives from major banks. This price is used as a benchmark for gold trading worldwide. However, the price of gold in a particular country can be affected by various factors such as the local currency exchange rate, taxes, import duties, and local demand. Countries with High-Purity Gold Gold purity is measured in karats, with 24-karat gold being the purest form. Pure gold is too soft for use in jewelry, so it is often alloyed with other metals to increase its durability. However, some countries are known for producing gold with a high purity level, making it more valuable. Canada:One of the largest gold-producing countries in the world, and its gold is known for its high purity. The gold produced in Canada is usually between 18 and 24 karat, with some mines producing gold that is 99.999% pure. The United States: The U.S. is also a significant producer of gold, and its gold is known for its high purity. The gold produced in the United States is usually between 14 and 24 karat, with some mines producing gold that is 99.99% pure. Australia: is the world’s second-largest gold producer, and its gold is known for its high purity. The gold produced in Australia is usually between 18 and 24 karats, with some mines producing gold that is 99.99% pure. South Africa: is the world’s largest producer of gold, and its gold is known for its high purity. The gold produced in South Africa is usually between 14 and 24 karats, with some mines producing gold that is 99.99% pure. China: is the world’s largest gold producer, and its gold is known for its high purity. The gold produced in China is usually between 18 and 24 karats, with some mines producing gold that is 99.99% pure. Russia: is one of the largest gold-producing countries in the world, and its gold is known for its high purity. The gold produced in Russia is usually between 18 and 24 karats, with some mines producing gold that is 99.99% pure. Peru: is a significant producer of gold, and its gold is known for its high purity. The gold produced in Peru is usually between 18 and 24 karats, with some mines producing gold that is 99.99% pure. Ghana: is Africa’s second-largest gold producer, and its gold is known for its high purity. The gold produced in Ghana is usually between 18 and 24 karats, with some mines producing gold that is 99.99% pure. Mexico: is a significant producer of gold, and its gold is known for its high purity. The gold produced in Mexico is usually between 18 and 24 karats, with some mines producing gold that is 99.99% pure. Brazil: is a significant producer of gold, and its gold is known for its high purity. The gold produced in Brazil is usually between 18 and 24 karats, with some mines producing gold that is 99.99% pure. Buy Pure Gold Coins You can buy pure gold coins if you want to invest in pure gold. These coins are made of high-purity gold and are recognized worldwide as a valuable commodity. Some popular pure gold coins include the American Gold Eagle, Canadian Gold Maple Leaf, South African Krugerrand, and Australian Gold Kangaroo. Top 10 Gold-Producing Countries The top 10 gold-producing countries in the world are: China: is the world’s largest producer of gold, producing 383.2 metric tons of gold in 2020. The country’s gold reserves are estimated to be around 2,000 metric tons. Australia: is the world’s second-largest gold producer, producing 321.1 metric tons of gold in 2020. The country’s gold reserves are estimated to be around 10,000 metric tons. Russia: is one of the largest gold-producing countries in the world, producing 312.2 metric tons of gold in 2020. The country’s gold reserves are estimated to be around 2,300 metric tons. The United States: is the fourth-largest gold producer in the world, producing 190.2 metric tons of gold in 2020. The country’s gold reserves are estimated to be around 8,000 metric tons. Canada: is the fifth-largest gold producer in the world, producing 164.6 metric tons of gold in 2020. The country’s gold reserves are estimated to be around 2,500 metric tons. Peru: is a significant producer of gold, producing 143.8 metric tons of gold in 2020. The country’s gold reserves are estimated to be around 2,400 metric tons. Ghana: is Africa’s second-largest gold producer, producing 142.4 metric tons of gold in 2020. The country’s gold reserves are estimated to be around 1,000 metric tons. South Africa: is the world’s largest producer of gold, producing 118.2 metric tons of gold in 2020. The country’s gold reserves are estimated to be around 6,000 metric tons. Mexico: is a significant producer of gold, producing 105.5 metric tons of gold in 2020. The country’s gold reserves are estimated to be around 100 metric tons. Brazil: is a significant producer of gold, producing 92.8 metric tons of gold in 2020. The country’s gold reserves are estimated to be around 2,300 metric tons. Which gold is best for jewelry? When it comes to jewelry, the purity of gold used can vary depending on the desired color and durability of the piece. 24-karat gold is too soft for most jewelry applications, so it is often alloyed with other metals to make it more durable. The most commonly used alloys are 18-karat and 14-karat gold. 18-karat gold contains 75% gold and 25% other metals, which gives it a bright, warm color and makes it more durable than 24-karat gold. As a result, it is a popular choice for engagement rings and other fine jewelry. 14-karat gold contains 58.5% gold and 41.5% other metals, which makes it more durable than 18-karat gold. It has a slightly lighter color than 18-karat gold and is a popular choice for everyday jewelry such as necklaces, bracelets, and earrings. In addition to karate, the color of gold used in jewelry can also vary. Yellow gold is the most traditional choice and is created by alloying pure gold with copper and silver. White gold is created by alloying pure gold with palladium or nickel and is a popular choice for engagement rings and wedding bands. Rose gold, which has a pinkish hue, is created by alloying pure gold with copper. When buying gold jewelry, it is essential to ensure that it is genuine and not a counterfeit. Look for markings on the piece indicating its karatage, and also consider purchasing from a reputable jeweler. Conclusion Gold is a precious and sought-after metal used for thousands of years for currency, jewelry, and investment purposes. While the price of gold may vary depending on location, the purity and quality of gold produced in various countries can also vary. Countries such as Switzerland, Australia, and Canada are known for producing high-purity gold, while countries such as China and Russia are the largest producers of gold in the world. When it comes to jewelry, the purity and color of gold used can vary depending on the desired durability and aesthetic. Investing in pure gold coins or gold bullion can be a smart way to diversify your investment portfolio while buying gold jewelry can provide a beautiful and lasting heirloom. Regardless of your interest in gold, it is essential to ensure that any gold you purchase is genuine and high-quality. If you are interested in learning more about gold and other precious metals, American Bullion is a great resource. They offer a wide range of products and services, including gold and silver coins and bars, as well as IRA services. They also have a team of knowledgeable professionals who can help you navigate the market and make informed decisions about your investments. Contact American Bullion today to learn more about how you can diversify your portfolio with precious metals. The post The Best Gold in the World & Top 10 Gold Producing Countries in 2025 first appeared on American Bullion. -
Who Flipped The Switch? Bitcoin STHs Accumulate While LTHs Take Profit
um tópico no fórum postou Redator Radar do Mercado
Over the last month, Bitcoin ranged within the $100,000 — $110,000 price region until its recent breakout to reach a new all-time high. On-chain data show that a shift in BTC holder behavior may have played a significant role in the flagship cryptocurrency’s recent price action. LTHs Begin Distributing, But STHs Accumulate In a July 12 post on the X platform, on-chain analyst Boris explained how a shift in Bitcoin holder activity has affected the market over the past months. This explanation was based on indicators measuring the Accumulation Vs Distribution of Long-Term Holders (LTH) and Short-Term Holders (STH). For these two holder categories, the metric tracks and analyzes wallet behavior to determine whether they are increasing or decreasing their Bitcoin holdings over time. Related Reading: Bitcoin Breaks Records: What Miners and Leverage Traders Are Doing Behind the Scenes For the long-term holders, the chart above shows how accumulation grew from the later days of May to the end of June. This is represented by the growing green graphs over the red. Within the same timeframe, the chart below shows short-term holders were represented more by the red graphs than the green, indicating more distribution than accumulation in the past month. Boris credited the LTHs for Bitcoin’s survival above the $100,000 support zone. “Despite heavy STH distribution and retail selling pressure, BTC defended the 100K support — a clear sign of structural accumulation led by LTH wallets,” the on-chain analyst said. According to Boris, the short-term holders were observed to have sold more than 563,000 BTC as Bitcoin continued to range. As this happened, the Long-Term holders steadily accumulated Bitcoin, and this absorbed most of the selling pressure from STHs. However, this dynamic seems to have reversed very recently. The online pundit reported that the Long-Term Holders started distributing their Bitcoin holdings. This sell-off from the LTHs may be a result of profit-taking, as the cryptocurrency’s upward drift would necessitate. On the other hand, the short-term holders have started to accumulate Bitcoin. This trend seen with this reactive group of investors indicates renewed retail interest or speculative entry amidst the current bullish rally. Boris further inferred that this handover from LTH support to STH support must have fuelled Bitcoin’s latest breakout, as short-term momentum is injected into the market. What’s Next For Bitcoin? While this rotation of supply between holder classes may not be strange in crypto market cycles, the scale and timing of this switch suggest that Bitcoin’s price action holds more interesting rallies in the near future. However, if the short-term buying pressure should taper, the absence of long-term support may cause a lower support to be retested. As of this writing, Bitcoin is valued at $117,300, reflecting no significant movement in the past 24 hours. -
XRP To Hit $4 This Week? This Crypto Expert Thinks So
um tópico no fórum postou Redator Radar do Mercado
XRP is back in the spotlight after a sudden pop in price. At press time, the token traded at $2.80, up 1.5% in the past 24 hours. Earlier today, it even hit $2.90 before easing back. Traders haven’t seen XRP at these levels since the first week of March, and chatter is growing across trading desks and social channels. Market Data: Last Week’s Rally Tops 25% XRP’s weekly gains now stand around 23%, giving long‑time holders a welcome lift. Bitcoin’s break above $118,800—and its steady hold near $118,000—has opened space for altcoins to shine. Still, only 28 out of the top 100 non‑stablecoin tokens have outpaced Bitcoin over the past 90 days, keeping the Altcoin Season Index at just 28/100. That tells us this isn’t a full‑blown altcoin boom yet, but XRP has broken out anyway. XRP Finds Path To $4 Based on reports, crypto educator Edoardo Farina tweeted that seeing XRP north of $4 “as early as this week” wouldn’t be a shock. Pushing past $4 would mean a 50% jump from current levels and clear the old all‑time high of $3.85 set in January 2018. Such a move could come in a fast burst rather than a slow grind, driven by sudden FOMO among buyers chasing new peaks. Ripple Partnerships And ETF Push Ripple has been busy on the partnership front. In early July, the company teamed up with BNY Mellon to custody its RLUSD stablecoin, the 8th‑largest stablecoin by market cap, aiming to draw in big institutions. Meanwhile, futures‑based XRP ETFs from ProShares and others launched in July, and more than 10 spot‑XRP ETF applications are now under SEC review. Any green light on a spot ETF could send demand—and price—higher. XRP Price Prediction According to the latest price prediction, XRP is expected to slip by 0.62% and reach $2.75 by August 12, 2025. Technical indicators still lean bullish, and the Fear & Greed Index sits at 74 (Greed). Over the last 30 days, XRP posted 18/30 green days with 6.88% price swings, data from CoinCodex shows. Regulatory Risks And Next Steps Even with positive signs, XRP faces hurdles. The SEC hasn’t approved any altcoin ETFs yet, and updates in Ripple’s ongoing lawsuit could trigger fresh volatility. Traders should watch headline risks closely. For now, gains have been impressive, and the coin’s four‑month high hints at more action ahead. Featured image from Meta, chart from TradingView -
Africa crypto news in review: Roqqu expands to Kenya as South Africa cracks down on scams. Ghana to clarify on VASP registration. Nigerian exchange Roquu has acquired a Kenyan startup as it eyes the East African market. Meanwhile, South African regulators are stepping up their efforts to combat fraud in the online crypto space. In Ghana, the Central Bank is finally set to issue directives on registration for Virtual Asset Service Providers (VASPs). Clarity will only encourage more businesses to set up shop, allowing users to get exposure in the next 1000X cryptos. Let’s take a brief look at these continental headlines below: Kenya Crypto News: Nigerian Exchange Acquires Kenyan Startup Nigerian crypto exchange Roqqu has acquired Kenyan startup Flitaa as it eyes growth in the East African market. Flitaa launched in 2019 and operates in Kenya, Tanzania, Uganda, and Ghana. Roqqu acquired the startup to become a truly pan-African platform, boosting the number of people investing in some of the best cryptos to buy. The East African market is fertile ground for the Nigerian entity. Kenya and Uganda are also anglophone countries, with supporting regulatory frameworks for external investors. Kenya’s move to enact the Virtual Assets Providers Bill will clarify the market for external investors looking to enter. Roquu has made an early bet on this growth, hoping to become a notable player in these markets. DISCOVER: 20+ Next Crypto to Explode in 2025 South Africa Crypto News: Regulators Crack Down on Online Scams The financial market regulator in South Africa, the Financial Sector Conduct Authority (FSCA), has announced that it will spend 200 million Rand over the next 18 months to combat online scams. This move comes amid South Africa’s general reckoning and need to modernize its financial sector regulation. Unfortunately, crypto is a component of the scam blueprint. South Africa has had several infamous cases, such as the disappearance of about 70,000 BTC from a platform called Africrypt in 2021. The investment in cracking down on online scams can be positive for the crypto sector, which has struggled with the proliferation of such entities. Ghana Crypto News: Central Bank Issues Directives On Registration After months of hinting at new regulations, the Central Bank of Ghana has issued a directive for all virtual asset service providers to register by August 15. The Central Bank is issuing the directive to comply with international trends on disclosure and regulation of crypto exchanges. For years, Ghana had little regulation of the crypto sector. However, the growing usage in the local market and pressure from international entities have resulted in this update. Crypto stakeholders will look to comply with this deadline to continue operations in this market. DISCOVER: 16 Next Crypto to Explode in 2025: Expert Cryptocurrency Predictions & Analysis Africa Crypto News: Roqqu In Kenya, Ghana On VASP Registration Kenya Crypto News: Roqqu expands to Kenya after Flitaa acquisition South Africa Crypto News: Financial Sector Conduct Authority to combat online scams Ghana Crypto News: Central Bank of Ghana wants crypto businesses to register by August 15 The post Africa Crypto News Week in Review: Nigeria Exchange In Kenya, South Africa Enforcement Action, Ghana Central Bank On VASP Registration appeared first on 99Bitcoins.
-
Bitcoin Price Could Soar To $146K In The Next Leg Up — Analyst Explains How
um tópico no fórum postou Redator Radar do Mercado
After going on an impressive run to close the week, the Bitcoin price has become relatively steady over this weekend. The premier cryptocurrency has shown some signs of indecision and continued to move sideways within the $117,000 and $118,000 range. According to a prominent online pundit, the Bitcoin price might be at a critical juncture that could decide its future over the next few weeks. Insights from a technical analysis model suggest that the price of BTC might run up to an unprecedented high of $143,000 once it overcomes the next resistance level. BTC Needs To Break This Resistance Level To Continue Rally In a July 12 post on social media platform X, Alphractal founder & CEO Joao Wedson revealed that the Bitcoin price faces significant resistance between $118,900 and $120,000. This price evaluation is based on the Bitcoin Power Law model, which provides a mathematical description of BTC’s historical price trends. The Bitcoin Power Law model estimates the network effect and adoption curve without speculation. Using this framework, the pricing model provides long-term support and resistance levels or “bands” on the Bitcoin price chart. Wedson revealed that the Power Law model indicates that the Bitcoin price faces significant resistance between the $118,900 and $120,000 region. According to the on-chain analyst, the market needs to breach the Alpha Price — which lies somewhere around $119,300. For context, the Alpha Price refers to a major inflection point in the Power Law model and a level that the Bitcoin price needs to break and stay above to enter the next significant phase of the bull cycle. In essence, the BTC price must witness a sustained break above $119,300 to continue its rally. Wedson mentioned that the price of BTC will need to show resilience in order to breach the psychological $120,000 level. However, it might need to consolidate first and perhaps take some long traders out of the market before overcoming the $120,000 level, the on-chain analyst noted. According to Wedson, a sustained breach of the $120,000 level will signal the beginning of an even much bigger rally for the market leader. The on-chain analyst put the target for this rally at between $143,000 and $146,000, marking the Bitcoin price top in this cycle. Bitcoin Price At A Glance As of this writing, the price of BTC stands at around $117,530, reflecting no significant movement in the past 24 hours. Nevertheless, the flagship cryptocurrency is up by nearly 9% on the weekly timeframe. -
Bitcoin Long-Term Holders Remain Steady As CDD Normalizes After False Alarm
um tópico no fórum postou Redator Radar do Mercado
Bitcoin is testing uncharted territory after breaking past its previous all-time high of $112,000 last Thursday, igniting a powerful new phase in the bull market. With the price currently hovering above $117,000, bulls are firmly in control as optimism spreads across the crypto market. The breakout comes after weeks of tight consolidation, signaling renewed confidence among investors and traders. On-chain data from CryptoQuant adds further support to the bullish narrative. The Coin Days Destroyed (CDD) metric—used to assess whether long-term holders are selling—has returned to a relatively low average despite the rise in price. This suggests that experienced holders are not offloading their positions, but instead continuing to hold through the rally. With long-term holders largely inactive and momentum accelerating, Bitcoin appears to be entering a decisive phase. As macroeconomic conditions remain favorable for risk assets, and with institutional demand rising, all eyes are now on how BTC behaves at these new highs—and whether the rest of the crypto market will follow its lead. Bitcoin Prepares For A Massive Surge Bitcoin continues to trade above key psychological and technical levels, signaling that the market is entering an expansion phase with the potential for a massive surge. After clearing its previous all-time high and consolidating around $117,000, Bitcoin’s structure looks increasingly bullish. Analysts and traders are closely watching on-chain indicators to confirm whether long-term holders are beginning to exit, but so far, the data suggests they are not. Top analyst Darkfost shared relevant insights regarding the Coin Days Destroyed (CDD) metric, a key tool used to assess long-term holder activity. CDD calculates how long a Bitcoin stays unmoved before a transfer, revealing long-term participants’ behavior. Recently, the metric saw a sharp spike, raising initial concerns about possible distribution. However, it was later confirmed that the move involved 80,000 BTC in an internal transfer — no actual selling occurred. Since that event, the CDD has returned to its previous low range, especially when compared to Bitcoin’s soaring price. This signals that long-term holders are still sitting tight, showing no urgency to sell into strength. Their conviction reflects growing expectations of higher prices ahead, supported by macro conditions, increasing adoption, and rising institutional interest. With strong hands holding firm and momentum building, Bitcoin appears poised for continuation. As long as key support levels are maintained and long-term holders remain inactive, the setup favors an explosive move that could redefine price discovery in this cycle. Price Discovery Kicks In: Momentum Accelerates Bitcoin’s three‑day chart shows a textbook breakout from eight weeks of compression. Thursday’s candle closed firmly above the former record cluster at $109,300, opening the door for a vertical push that carried price to $118,800 on the very next print. The candle body towers well above the 50‑period SMA, while the 100‑ and 200‑period averages slope higher beneath, confirming a bullish long‑term structure. The old resistance band between $105,000 and $109,300 now flips into first demand; any orderly retest that wicks into that zone would likely attract sidelined buyers. Below it, $103,600—the mid‑range support that capped drawdowns all spring—remains the line in the sand for the current trend. Upside projections derive from the height of the year‑long range (~$15 k). Adding that measure to the breakout point targets $124–125 k as the next logical objective, with the psychological $120 k round number a potential interim stall area. Momentum oscillators on medium time‑frames are stretched but not at extreme levels, suggesting room for continuation before a cooling period becomes necessary. Featured image from Dall-E, chart from TradingView -
Ouro Pode Perder Força no Médio Prazo, Alerta o World Gold Council
um tópico no fórum postou Igor Pereira Sentimento de Mercado
📉 Ouro Pode Perder Força no Médio Prazo, Alerta o World Gold Council Por Igor Pereira – Analista de Mercado Financeiro e Membro Junior WallStreet NYSE Em novo relatório publicado hoje, o World Gold Council (WGC) aponta que o ouro pode enfrentar pressão baixista no médio prazo, caso o ambiente geopolítico e comercial global comece a se estabilizar. A possível redução dos riscos globais, somada a um enfraquecimento da demanda por parte dos bancos centrais e investidores de varejo, pode desencadear uma correção nos preços do metal precioso. 🧭 Geopolítica Menos Tensa Pode Reduzir Demanda por Refúgios Segundo o estudo, o preço do ouro tem sido amplamente sustentado por fatores de risco sistêmico — como tensões militares, guerras tarifárias, crises monetárias e polarização política global. No entanto, se esses vetores de instabilidade forem amenizados nos próximos trimestres, o ouro pode perder seu apelo como porto seguro. 📉 Demanda Institucional e Varejista em Queda? Outro ponto de atenção está na demanda física e financeira por ouro. O World Gold Council observa: Compras por bancos centrais desaceleraram no segundo trimestre de 2025, após recordes consecutivos desde 2022; Investidores de varejo têm buscado maior exposição a renda fixa, criptoativos e ações em setores de tecnologia e IA; A redução na emissão de novos ETFs lastreados em ouro e o menor fluxo para os contratos da Comex indicam perda momentânea de tração institucional. Esses elementos juntos podem pressionar o ouro a níveis mais baixos — especialmente se não houver novos choques externos ou aceleração inflacionária nos EUA e Europa. 🔍 O Que Esperar no Mercado de Ouro (XAU/USD) 1. Cenário Técnico Atual O XAU/USD segue lateralizado entre US$ 3.200 e US$ 3.400, com resistência no topo histórico e suporte em médias móveis de 50 e 100 períodos. 2. Fatores de Pressão no Médio Prazo Redução no risco global → Menor busca por proteção; Dólar americano fortalecido → Competição direta com o ouro; Juros altos persistentes → Aumento da atratividade dos Treasuries. 3. Riscos de Alta Apesar da perspectiva de correção, o mercado segue atento a: Escalada militar no Oriente Médio ou Sudeste Asiático; Deterioração fiscal nos EUA e ameaça à confiança nos Treasuries; Retomada de compras por bancos centrais de mercados emergentes. 🎯 Conclusão do Analista A possível queda na demanda institucional e no risco global representa uma ameaça técnica ao XAU/USD no médio prazo. Se confirmada, a correção pode levar o metal para níveis mais baixos — com destaque para o suporte em US$ 3.180 a US$ 3.200, região que funcionaria como base de reavaliação estrutural. Igor Pereira – Analista de Mercado Financeiro e Membro Junior WallStreet NYSE ExpertFX School