

Todas Atividades
Atualizada automaticamente
- Recentemente
-

CMOC’s IXM declares force majeure on cobalt deliveries from Congo
um tópico no fórum postou Redator Radar do Mercado
IXM, a metals trading unit of CMOC Group (SHA: 603993), has declared force majeure on its cobalt supply contracts due to an ongoing export ban in the Democratic Republic of Congo (DRC). The ban, initially set for four months, has now been extended until September, halting cobalt shipments from key suppliers. Export ban extended The DRC government extended its cobalt export ban by another three months on June 21, citing a need to address market oversupply and stabilize prices. The measure, enforced by the Authority for the Regulation and Control of Strategic Mineral Substances’ Markets (ARECOMS), began on February 22, 2025. It has disrupted shipments from major producers like Tenke Fungurume Mining and CMOC Kisanfu Mining, forcing IXM to suspend contract deliveries. The DRC accounts for over 80% of global cobalt output. The export halt could remove more than 100,000 tonnes of cobalt from the market over a seven-month period, fueling supply concerns. Glencore (LON: GLEN), the world’s second-largest cobalt producer, also declared force majeure following the initial suspension. Meanwhile, Cobalt Holdings shelved a planned $230 million IPO in London, which aimed to fund discounted cobalt purchases from Glencore. -
Analyst Reveals Rational Behind XRP Price Reaching $9.5 And $37.5
um tópico no fórum postou Redator Radar do Mercado
Crypto analyst Egrag Crypto has provided a detailed breakdown of how the XRP price could reach between $9.5 and $37.5. He alluded to previous cycles as the rationale behind why the altcoin could reach such ambitious targets in this market cycle. Rationale Behind XRP Price Rally To $9.5 And $37.5 In an X post, Egrag Crypto stated that historical cycles show that the XRP price always rises above the Exponential Moving Average (EMA) and then retests it. He added that the final move from that retest point to the cycle’s top creates the blowoff peak. In Cycle 1, XRP recorded around a 2,000% gain while the altcoin surged 455% from the retest point in Cycle 2. Egrag Crypto then applied these percentages to the current cycle to show why the XRP price could reach $9.5 and $37.5. He noted that after the initial surge and retest in April 2025, the EMA will likely rise with the price, setting the stage for the next big move. Based on these historical blowoff phases, the analyst said that XRP could record another 2,000% increase and reach $37.5. On the other hand, the XRP price could mirror the second cycle and record a more conservative 455% rise, which puts the altcoin at $9.5. Egrag Crypto’s accompanying chart showed that XRP could reach either of these targets by September 1 later this year. Meanwhile, the analyst advised market participants to choose their targets wisely. He also told them to set their exit plans, avoid getting caught up in hype, stick to their strategy, and get prepared. Breakout In Progress For XRP In an X post, crypto analyst CasiTrades stated that the $2.25 level is loading for the XRP price following its reclaim of the $2.07 level. Based on this price action, she remarked that a breakout was in progress. This $2.25 also represents the macro .382, a key level which the analyst has been alluding to for months. CasiTrades declared that momentum is building for the XRP price and that Ripple’s decision to drop its cross-appeal against the SEC is further fueling this momentum. From the current level, she stated that she is watching two key scenarios in the short term. First, the altcoin could move into $2.30, then pull back to test $2.25 as support. The analyst remarked that this would be “ideal and healthy.” For the second scenario, CasiTrades predicts that the XRP price could push harder through to $2.45, which is closer to the $2.69 resistance. Then, the altcoin would witness a slight pullback before touching the $2.69 level with resistance. For this scenario, she believes that a retest of $2.25 later would be expected. At the time of writing, the XRP price is trading at around $2.19, up in the last 24 hours, according to data from CoinMarketCap. -
The British pound has edged lower at the start of the week. GBP/USD is trading at 1.3689 down 0.19% in the North American session. UK GBP for Q1 higher than expected The UK economy grew by 0.7% q/q, unchanged from the initial estimate. This follows a gain of 0.1% in Q4 2024 and marked the strongest growth in a year. The gain was driven by strong growth throughout the economy, including a 0.7% gain in the services sector. Opinions are the authors'; not necessarily that of OANDA Business Information & Services, Inc. or any of its affiliates, subsidiaries, officers or directors. The provided publication is for informational and educational purposes only. If you would like to reproduce or redistribute any of the content found on MarketPulse, an award winning forex, commodities and global indices analysis and news site service produced by OANDA Business Information & Services, Inc., please refer to the MarketPulse Terms of Use. Visit https://www.marketpulse.com/ to find out more about the beat of the global markets. © {CURRENT_YEAR} OANDA Business Information & Services Inc.
- Hoje
-
Wave 3 Ignites As XRP Breaks Structure—Analyst Says ‘Fireworks Ahead’
um tópico no fórum postou Redator Radar do Mercado
Hours after Ripple Labs said it would abandon its long-running appeal in its securities case with the US Securities and Exchange Commission, watched market technician CasiTrades (@CasiTrades) on X argued that XRP’s price structure has already completed its corrective phase and is “now wave 3 in motion.” The pseudonymous trader described how Friday’s slide to $2.07 had “tagged” three separate Fibonacci confluence markers—the 0.618 retracement of the March-to-May rally, a 1:1 equality projection for wave C of the prior correction, and a 0.618 extension of sub-wave 5. “The market snapped upward from that exact price,” she observed, before adding: “$2.07 tagged. $2.25 loading. XRP breakout in progress!” XRP Enters Wave 3 By midday in Europe on Monday XRP was changing hands at $2.19, roughly 4% above Friday’s close and 8.5% higher than a week ago. That recovery has carried the token to the edge of the next “major test” cited by CasiTrades: the long-monitored $2.25 zone, which she notes coincides with the 0.382 Fibonacci retracement measured from XRP’s 2021 swing high. In classical Elliott Wave analysis, a decisive breach and subsequent retest of that level would validate the start of a powerful third wave, the phase in which momentum typically accelerates and sentiment flips decisively bullish. CasiTrades outlined two near-term paths: either a brief thrust to $2.30 followed by a healthy back-test of $2.25, or a more explosive extension toward $2.45–2.69 before any significant pull-back. “From here, I’m watching two key scenarios short-term: 1) A move into $2.30, then a pullback to backtest $2.25 as support. This would be ideal and healthy. 2) Or, price pushes harder through to ~$2.45, closer toward $2.69 resistance. Has a small pullback, before touching $2.69 with resistance. In this plan, a backtest of $2.25 later would be expected,” Casi writes via X. In either scenario, she argues, the structural message is the same: “Flipping that level opens the door for the next full breakout… once these local resistances are out of the way → fireworks.” The technical argument lands at a moment when a key fundamental overhang appears to be fading. On June 27 Ripple chief executive Brad Garlinghouse announced that the company will withdraw the cross-appeal it filed last year contesting parts of Judge Analisa Torres’s split decision on XRP sales. “We’re closing this chapter once and for all,” Garlinghouse wrote on X, adding that the SEC “was also expected to drop its appeal.” The move came one day after Torres rejected a joint request from both parties to shrink Ripple’s civil penalty to $50 million and dissolve her permanent injunction. That backdrop helps explain why the Fibonacci “golden-ratio” bounce at $2.07 drew such an emphatic response. But for now, the market’s focal point is whether XRP can turn the $2.25 shelf from resistance into support. If it does, the next cluster of historical supply sits between $2.60 and $2.70—the area that capped rallies in December 2021 and March 2022. A break beyond that zone would leave little chart resistance before psychological milestones at $3.00 and the all-time closing high near $3.40 set in January 2018. Even so, technicians caution that Elliott Wave targets remain probabilistic, not predictive certainties, and that any new macro-regulatory twist could reset the calculus. Friday’s ruling also left Ripple’s injunction intact, meaning the company must still navigate a compliance regime that did not exist when the lawsuit began in 2020. Whether those realities temper the exuberance around wave 3 remains to be seen. In CasiTrades’ words, however, timing is everything: “This is exactly why we rely on TA. The charts help us spot setups before the news hits. News hits harder after price has positioned.” For a market that has waited more than four years to see its signature legal saga reach closure, traders appear ready to test that maxim on the road to $2.25—and beyond. At press time, XRP traded at $2.19. -
Guest column: Benchmarking Canada’s hard rock lithium projects
um tópico no fórum postou Redator Radar do Mercado
Canada has seen a surge in hard rock lithium exploration and development activity following the discovery of Patriot Battery Metals’ globally significant Corvette (CV5) pegmatite in Quebec in 2021, the enactment of the US Inflation Reduction Act (IRA) which incentivizes “friendshoring” of supply chains, and a rally in global lithium prices that peaked in 2022. A host of feasibility studies emerged between 2023 and 2025, the latest of which Adamas Intelligence benchmarked in this insight. Existing producers of spodumene concentrate include the twice bankrupt and re-capitalized North American Lithium mine in Quebec (a joint venture between Sayona Mining and Piedmont Lithium), the Chinese-owned Tanco mine in Manitoba, and Quebec’s Whabouchi mine due to be commissioned in 2025 after also emerging from bankruptcy proceedings. Spodumene concentrates have mostly been exported to China for chemical conversion. Localization of conversion capacity has been envisioned for decades, but a number of factors including the remoteness of Canada’s spodumene endowments, the marginal profitability of spodumene concentrators together with the immaturity of lithium refining intellectual property and skillset development, have meant these endeavors have failed to attract investment. Tesla has taken it upon itself and is currently commissioning a conversion facility in Texas (with offtake from the North American Lithium mine), while Rio Tinto is aiming to commission a conversion facility in Bécancour integrated with the Whabouchi mine in 2026. The outstanding cohort of Canadian hard rock lithium developers are increasingly tapping technical and funding partners to assist project development. One such example is Frontier Lithium which recently signed a joint venture agreement with Mitsubishi Corporation of Japan. Both provincial and federal governments have also pledged financial support for the project. In May this year, Frontier Lithium released a Definitive Feasibility Study for the PAK spodumene concentrator in Ontario. To benchmark the results, Adamas Intelligence compared PAK to seven selected spodumene concentrate projects which range in accuracy from Preliminary Economic Assessment to Feasibility Study levels. First, capital intensity is calculated taking life-of-mine capital requirements on a per tonne produced (lithium carbonate equivalent contained in spodumene concentrate) basis, gross of government tax credits, such as the federal Clean Technology Manufacturing Investment Tax Credit (CTM-ITC). Next, expected operating costs are broken into the five cost centers – mining, processing, transport, general and administrative, and sustaining and closure. The results are presented on a per tonne 6.0% Li2O spodumene concentrate equivalent basis. Note: Price-dependent factors such as royalties and bi-product credits are excluded. Closure costs are also inconsistently accounted for in the studies. Frontier Lithium’s PAK screens as a high CAPEX, low OPEX project. The 1.0 Mtpa concentrator is set to cost US$688M which is very high by global standards. This is in part due to the relative remoteness of the project in northwestern Ontario. PAK has the highest reserve grade of the group, at 1.51% Li2O. Its fine-grained spodumene ore demands a whole-of-ore froth floatation plant, conceptually similar to recently commissioned Kathleen Valley mine in Western Australia and Ganfeng Lithium’s Goulamina mine in Mali. The thick, vertically dipping ore bodies, lend to low strip ratio, low-cost open pit mining. Despite whole-of-ore froth floatation placing greater demands on comminution and material handling, PAK’s processing costs are comparable to peers who have adopted dense media separation process designs like the Adina and Galaxy projects. PAK’s concentrate transport costs are also low, given delivery is set for the presumptive chemical plant location in Thunder Bay on Lake Superior, Ontario. The Seymour project shares this characteristic. In contrast, the remaining six projects in Quebec deliver to ports on the St. Lawrence River, with direct access to international markets via ocean freight. On this basis, comparison of transportation costs is not like-for-like. The remaining cost centers, G&A and sustaining capital, demonstrate the study managers’ contrasting approach to cost allocation and capitalization as they pertain to reporting standards (JORC vs. NI 43-101). Ultimately, these can be reconciled within normalized incentive prices, IRR or NPV calculations. To harmonize both capital and operating cost metrics without the use of discounted cash flow models, an incentive price is formulated with the units USD per tonne SC6.0% Li2O: Note: It is assumed the projects target an IRR of 20%, and total corporate taxes (provincial and federal) are 31.5% in Ontario and 38% in Quebec. $1,500/t SC6 is widely considered an appropriate price to incentivize the required volumes of spodumene concentrate to meet long term demand. To achieve 20% IRR, a minimum rate of return widely accepted by industry, PAK requires a pricing environment of around $1,500/t SC6. By comparison to Canadian peers, and certainly in a global context, PAK demonstrates marginal economics. Encouragingly, PAK’s incentive price is lower than the recently constructed Whabouchi mine per its December 2022 pre-feasibility study. It is worth highlighting Whabouchi’s costings also included sunk CAPEX as the “half-completed plant” was re-capitalized, and the flowsheet reenvisioned under the new owners – Rio Tinto and the government-owned Investissement Quebec. In principle, PAK’s feasibility study level costings will be more conservative than half of the peer group assessed at PEA or PFS levels. Furthermore, PAK is uniquely royalty free within the peer group. By contrast, Winsome’s Adina project will pay out a 4% NSR, which at $1,500 SC6 price adds $55/t SC6 to its cost profile (this has not been considered within the above calculations). If we consider Moblan and Galaxy as strategically important growth projects for Sayona Mining (soon to be Elevra Lithium) and Rio Tinto, respectively, what remains are five flagship projects held by listed junior mining companies. In other words, it may be prohibitively difficult for outside capital to participate in these projects, thus the universe of pure-play eastern Canadian spodumene opportunities shrinks, and PAK then ranks behind Adina and Shaakichiuwaanann. With this glass-half-full perspective, third place is a respectable position. In our view, the project has the potential to attract the necessary capital and advance into construction, but only in a prolonged, pro-cyclical price environment, and only where friendshoring critical mineral supply chains are the order of the day. * Christopher Williams is an analyst with Adamas Intelligence Battery Metals Forecast Service. -
Can Cardano Lead In Bitcoin DeFi? Founder Says It Needs A Central Voice First
um tópico no fórum postou Redator Radar do Mercado
Cardano is making moves to become a hub for Bitcoin DeFi. According to Cardano founder Charles Hoskinson, the network has rolled out a string of upgrades, yet it still needs a strong message to win over users and investors. He argues that without a clear voice steering the story, those technical gains risk getting lost in the noise. Network Champions New Features Cardano’s team has added Leios, a new smart contract framework, and Hydra, a layer‑2 scaling solution that promises faster transactions. They’ve also launched the Midnight Glacier Drop, which aims to boost data privacy for on‑chain applications. Based on reports, Minswap—the largest decentralized exchange on Cardano—is preparing to support Bitcoin, with plans to tap into a $2 trillion liquidity pool. At the same time, Lace Wallet is gaining traction among everyday users, and USDM, a stablecoin backed by dollar reserves, is picking up steam. Hoskinson Points To Executive Gap Despite those wins, Hoskinson says Cardano is missing a “competent Foundation and executive authority” to shape market views. He’s taken to X to share his concerns, but some in the community have pushed back hard. A few podcasters and thought leaders have labeled Cardano a “dying chain.” Hoskinson admits that stepping into the narrative has drawn plenty of criticism—yet he feels it’s needed if Cardano is to claim its place in Bitcoin‑based finance. Input Output Global’s Role Input Output Global (IOG), Hoskinson’s company, will keep guiding Cardano as its core coordinator. He warns this work comes at a cost: “It’s been brutal and expensive this year,” he said, referring to waves of negative comments and legal threats. He adds that it’s “dehumanizing” to be blamed for every hiccup on the network while not getting credit for the wins. Rare Evo Conference In Focus Looking ahead, Hoskinson is counting on Rare Evo, a crypto conference, to reset the conversation. He believes the community will use that event to settle governance questions and update Cardano’s constitution with delegated executive powers. There’s even talk of a sovereign wealth fund to back Bitcoin DeFi on the chain. Built on top of Bitcoin, Bitcoin DeFi (BTCFi) is a network of decentralized financial applications. Last year, Hoskinson pushed a plan to convert $100 million worth of ADA into stablecoin liquidity. That idea sparked fierce debate. Now, he hopes Rare Evo will help turn bold ideas into solid support. Cardano’s path forward may hinge on blending strong tech work with a clear, unified story. As Bitcoin DeFi edges closer, the project that can tell the best story might win the most attention—and the most funds. Featured image from Unsplash, chart from TradingView -
Overview: The US dollar is consolidating in mostly narrow ranges against the G10 currencies. It is trading mostly softer against emerging markets currencies. The news stream features further progress of the US budget bill, which dropped the onerous "revenge tax" (Section 899), and there is talk of as many as a dozen trade framework agreements in the pipeline, ahead of the July 9 deadline. Canada dropped its threat on collecting funds today from its digital service tax, and this seemed to have jump started talks with the US. A deal is hoped for by July 21. China's PMI showed marginal improvement, and the PBOC set the dollar's reference rate at a new low since last November. After jumping more than 3% last week, the MSCI Asia Pacific equity index rose further today. Among the large bourses, Hong Kong, Taiwan, and India did not participate in the follow-through buying today. Europe's Stoxx 600 is paring last Friday's 1.1% gain, while US index futures are around 0.5%-0.7% better. Bond markets are firm. The JGB 10-year yield slipped slightly, while yields are softer in Europe. The UK Labour government made more concessions ahead of tomorrow's vote on disability welfare reforms to address the objections of around 120 Labour MPs. The 10-year Gilt yield is off almost two basis points, but the agreement seems to make Chancellor Reeves’ position untenable. The 10-year US Treasury yield is off a little more than two basis points to 4.25%. August WTI is consolidating in its recent range (~$64.50-$65.80). Gold first slipped to a new low for the month (slightly below $3249) before recovering to almost $3300, where it stalled. USD: The Dollar Index finished last week near session highs but still around the lows since March 2022. It looks weak but stretched. It settled inside the lower Bollinger Band (slightly below 97.10 today) after closing below it last Thursday. For high to low last week, it fell by about 2.4% and that was with a five-day drop arrested ahead of the weekend. It remains trapped in its trough today, unable to resurface above 97.30, so far. The year-end expected effective Fed funds rate also fell over those five sessions that DXY was falling and also steadied ahead of the weekend. The holiday-shortened week begins slowly with the Chicago PMI and Dallas Fed's manufacturing survey. The highlight is Thursday’s release of the June employment report. The slowing of the labor market is expected to be evident, with nonfarm payrolls slowing to around 116k from 139k in May, and the unemployment rate is seen ticking up to 4.3% from 4.2%. Auto sales are expected to have slowed further in June. It would be the third consecutive monthly slowing after the surge in March to beat the tariffs brought forward purchases. The last time US auto sales slowed for at least three consecutive months was in 2021. In terms of Treasury supply this week, there are no coupons being sold, only bills. Tomorrow, Fed Chair Powell is at an ECB conference where he will be on a panel with ECB's Lagarde, BOE's Baily, BOJ's Ueda, and Bank of South Korea's Rhee. EURO: A late bout of profit-taking did not prevent the euro from extending its advance for the seventh consecutive session ahead of the weekend. It is steady to firmer today and has not posted a losing session since June 17. It reached a marginal new high since September 2021 (~$1.1755) and settled outside the upper Bollinger Band (~$1.1745 today) for the third consecutive session. It is trading mostly between $1.1710-50 today. The eurozone M3 money supply rose 3.9% in May year-over-year (same pace as April) and matches the strongest growth since late 2022. Credit growth to the private sector increased slightly (2.4% vs. 2.3%). Germany is among the leaders. Berlin projects this year's budget shortfall will be around 82 bln euros, up from 33 bln euros last year. The government estimates the deficit will rise to 126 bln euros by 2029. It is not just the result of increased military spending. Germany aims to boost infrastructure spending by 55% this year to 115 bln euros. The markets will be more sensitive to tomorrow's preliminary estimate of June CPI. France and Spain reported at the end of last week, and German and Italy did so today. German states CPI seems consistent with a 0.1%-0.2% rise in the harmonized measure, due shortly, which could see the year-over-year rate 2.1%-2.2%. Italy's CPI rose by 0.2% for an unchanged year-over-year rate of 1.7%. Separately, Germany reported an unexpected 1.6% drop in May retail sales (0.5% expected in Bloomberg's survey). April's revision to -0.6% from -1.1% offered little consolation. CNY: The dollar stabilized against the offshore yuan ahead of the weekend after setting a new low for the year last Thursday (~CNH7.1525). The greenback finished last week firmly, near CNH7.1715 and was little changed on the week (<0.15%). The US dollar is trading in last Thursday's range (~CNH7.1525-CNH7.1745). The reference rate was set at CNY7.1586 (CNY7.1627 previously). That is the lowest since last November. China reported its June PMI earlier today. It was little changed. The manufacturing PMI edged up to 49.7 from 49.5. It is the third consecutive month below the 50 boom/bust level. The non-manufacturing PMI was slightly firm at 50.5 from 50.3. It finished last year at 52.2. The composite PMI rose to 50.7. Lastly, there is talk swirling around about changes in Beijing, with some of President Xi's military appointments being replaced. JPY: The dollar was confined to the narrowest range in a couple of months before the weekend. It traded well within Thursday's range (~JPY143.75-JPY145.25), which may still have near-term significance; pointing the near-term direction. It remains in that range today. The dollar has been alternating between weekly gains and losses in a sawtooth pattern since mid-May that has left it net-net little changed. Japan's industrial output has disappointed this year. In the first four months, it rose by a cumulative 0.3%. It rose by 0.5% in June, which disappointed expectations. The median forecast in Bloomberg's survey was for a 3.5% surge. Capital equipment rose 5.6% and autos and parts rose 2.5%, while aircraft parts tumbled 16.3%. The highlight of the week is tomorrow's Tankan Survey. It will likely reflect the uncertainty over the US tariff policy. Sentiment is expected to have softened. A bright spot may be capex plans, which are expected to rise from 3.1% in the last survey. Anticipated capex averaged 9.3% last year, 10.9% in 2023, and 15.4% in 2022. GBP: Sterling's four-day advance ended before the weekend. It still finished almost 2.0% higher on the week to record its third weekly advance in the past four weeks. After closing above the upper Bollinger Band for two consecutive sessions, sterling settled barely inside it ahead of the weekend, (~$1.3740 today). A break of $1.3680 could spur losses toward $1.3600 before the bulls are tested. The market paid little attention to the final look at Q1 GDP. That said, note, consumption rose by 0.4%, instead of 0.2% and business investment rose by 3.9%, not 5.9%, and both export and import growth was slightly less than initially estimated. The economy led the G7 growth in Q1 (0.7% quarter-over-quarter), but Q2 is a different story. It may be at or near the bottom. The median projection in Bloomberg's survey is for 0.2% growth and some work is needed to achieve that after April's monthly estimate showed a 0.3% contraction. CAD: Greenback found support near CAD1.3620 last Thursday and consolidating quietly until President Trump ended the trade talks with Canada over Ottawa's insistence on a digital tax. We suspect that Prime Minister Carney was pushing this to gain a new bargaining chit, and sure enough today, when the first payment was due, Canada withdrew the measure. In exchange, the US and Canada will resume negotiations, with an eye to reach an agreement by July 21. In reaction to new tariff threats, the US dollar rose to almost CAD1.3760, and Canadian equities were sold. The greenback was quickly pushed back and settled below CAD1.3700. It remains below there today and traded as low as CAD1.3655. Canada has a quiet week of market-sensitive data, and it does not release the June labor report until July 11. The markets do not put much weight on the PMI, though given the trade tensions with the US, May's merchandise trade balance will be of interest. However, it will be overshadowed by the US employment report at the same time on Thursday. AUD: The Australian dollar staged an impressive recovery off the $0.6375 low set amid elevated uncertainty after the US bombed Iran. The recovery stalled near $0.6565, a new high for the year. It consolidated ahead of the weekend and retreated back toward $0.6500. It is confined to a little more than a quarter-cent range between roughly $0.6525 and $0.6555. Australia reported private sector credit growth rose by 0.5% in May, after the 0.7% increase in April, which was the strongest since mid-2022. May retail sales and building approvals will be reported Wednesday, and both are expected to improve sequentially. They will be followed by May's merchandise trade balance, which is expected to have narrowed, and household spending. While the high frequency data may have headline risk, the market is very confident of a rate cut next week. It is 80% discounted in the futures market, which anticipates at least two more cuts this year. MXN: Less than 24-hours after the central bank cut the target rate by 50 bp for the fourth consecutive time, the Mexican peso rose to a new high since last August. Today, the dollar drew closer to the MXN18.80 area, which we have highlighted. A convincing break could target MXN18.60 next. On the upside, an initial bounce could carry the greenback toward MXN19.05. Even with last week's rate cut, the interest rate differential and weak greenback sentiment makes long peso carry trade against the dollar attractive. The swaps market is pricing in another quarter-point cut in the second half. This week's data, which includes May remittances, IMEF surveys, and domestic vehicle sales, may be more important to economists than market participants. Mexico has replaced Russia this year as the largest destination of Chinese auto exports, and reports suggest it has taken about a 30% market share. Preliminary data suggests Chinese brands outsold US brands in the first four months of the year, which partly reflects the adoption of inexpensive EVs. Disclaimer
-
 Hugo Pinheiro reagiu a a gallery image:
EURUSD 45M
Hugo Pinheiro reagiu a a gallery image:
EURUSD 45M
-
 Ouro em moedas emergentes dispara em 2025: proteção cambial e inflação explicam disparidade Por Igor Pereira, Analista de Mercado Financeiro – ExpertFX School O gráfico recém-divulgado pela Incrementum AG, com dados da LSEG Workspace, mostra um retrato claro da função do ouro como reserva de valor em tempos de instabilidade monetária: no acumulado de 2025 até o momento, o metal precioso subiu 134,5% na Venezuela (VES), 44,6% na Argentina (ARS) e 39,1% na Turquia (TRY) — refletindo diretamente as pressões inflacionárias e cambiais nesses países. Enquanto isso, moedas com fundamentos mais estáveis ou beneficiadas por políticas monetárias restritivas, como o real brasileiro (BRL) e o peso mexicano (MXN), registraram valorização mais moderada de 16% a 17%. O rublo russo (RUB) é a única exceção negativa, com queda de 14,4% — reflexo de fatores geopolíticos, intervenção cambial direta e controle de capitais. 💡 Interpretação: o ouro como termômetro de confiança monetária O desempenho do ouro em moedas emergentes funciona como um indicador implícito da perda de poder de compra local e da desvalorização real das moedas frente a um ativo neutro como o XAU. 📌 Top 5 maiores altas do ouro em moedas emergentes (2025 YTD): VES (Venezuela): +134,5% ARS (Argentina): +44,6% TRY (Turquia): +39,1% NGN (Nigéria): +29,6% IDR (Indonésia): +26,9% Esses países compartilham fatores como: Inflação elevada ou hiperinflacionária; Perda de reservas internacionais; Desconfiança institucional ou política cambial instável; Aumento do risco-país e fuga de capitais. Por outro lado, moedas como o BRL (+16,1%), MXN (+16,9%), CLP (+19,3%) e COP (+18,3%), apesar de também apresentarem desvalorização frente ao ouro, mostram resiliência relativa no cenário de 2025 — muitas vezes sustentadas por altas taxas de juros reais, fluxo de carry trade e exportações de commodities. 🟨 Impacto no mercado de ouro (XAU/USD) Essa disparidade entre moedas emergentes e o desempenho do ouro reforça dois pontos importantes: 1. Demanda física por ouro tende a aumentar em países com moedas em colapso Investidores locais buscam proteção patrimonial, migrando de moeda fiduciária para ouro físico, stablecoins ou dólares; O fluxo institucional para ETFs e contratos futuros tende a refletir esse movimento ao longo do tempo, elevando o preço do XAU/USD globalmente. 2. Alta do ouro em moedas locais não significa necessariamente alta do XAU/USD Em alguns casos, o preço do ouro em moeda local sobe por desvalorização do câmbio, não por valorização nominal do ouro; Ainda assim, o movimento indica demanda latente por hedge cambial, o que fortalece o papel do ouro como ativo estratégico de longo prazo. 🎯 O que esperar À medida que o cenário de inflação global persistente, déficits fiscais elevados e instabilidade política continua, o ouro tende a se valorizar não apenas como proteção contra a desvalorização cambial em mercados emergentes, mas também como ativo de reserva internacional alternativa ao dólar e aos Treasuries. Se o dólar perder força em função dos próximos cortes do Fed, como antecipado pelo mercado, o XAU/USD pode ganhar impulso renovado e ampliar sua dominância frente às moedas emergentes. 🧠 Opinião do analista Igor Pereira Este gráfico reforça o argumento central que temos sustentado na ExpertFX School: o ouro deixou de ser apenas um hedge contra inflação americana e se tornou um termômetro global de confiança monetária. As moedas emergentes, especialmente em regimes autoritários, populistas ou com políticas fiscais desordenadas, estão expondo sua fragilidade em relação ao ouro. Isso não apenas alimenta a demanda por ouro físico e digital, como também pressiona o sistema financeiro global a buscar alternativas de reserva de valor fora do sistema fiduciário tradicional. Para o trader, o XAU/USD deve ser monitorado com foco técnico, mas também com leitura institucional, geopolítica e macroeconômica. O ouro está deixando pistas claras nos gráficos e nos fluxos. Cabe ao trader lê-las com visão global.
 -
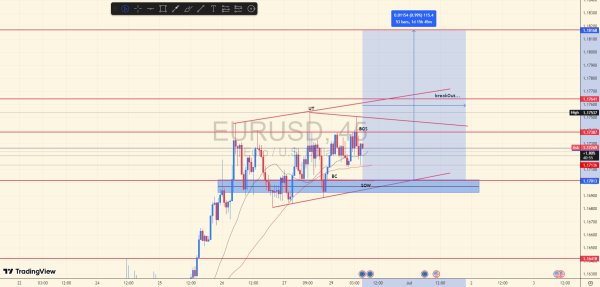 Perspectiva de análise Retest em (3) toques SOW, continuação de canal ascendente (breakDown) entre linha de tendência, possível quebra & breakOut de continuação. Gerenciamento stoploss não se deve ser maior que a vela vermelha abaixo do SOW.
 -
Bitcoin Freezes Over $100,000 As OG Whales ‘Dump On Wall Street’: Expert
um tópico no fórum postou Redator Radar do Mercado
While Bitcoin continues to hover above the $100,000 threshold, the driving forces behind this historic consolidation phase appear to be more complex than the surface-level narratives of institutional “FOMO” and ETF euphoria. According to multiple leading analysts, a silent rotation is underway—one that suggests long-term holders are offloading their positions while corporate treasuries and institutional buyers quietly absorb the flood. OG Bitcoin Whales Are ‘Dumping’ On Wall Street Charles Edwards, founder of Capriole Investments, delivered a sobering breakdown via X on June 29, challenging the prevailing belief that Bitcoin’s price stagnation amid surging demand is anomalous. “People are wondering why BTC has been stuck at $100K so long, despite the institutional FOMO,” he wrote. “Despite what X news might suggest, it’s because Bitcoin OGs (long-term holders) have been dumping on Wall St since the ETF Launch in January 2024, unloading their positions.” Edwards, known for blending on-chain metrics with macro frameworks, pointed to a visible dynamic shift that is now being captured in blockchain data. While older coins are being redistributed, a newer class of holders—primarily treasury-oriented entities—are stepping in aggressively. “We have clearly entered the heat of [the Treasury Company] trend today as many copy-cats have entered the market,” he said, referencing his earlier prediction on Bits and Bips that corporate adoption would eventually eclipse ETF inflows in relevance. What makes this transition particularly remarkable is the data behind it. Edwards highlighted that 6-month-plus BTC holders—commonly associated with more strategic, non-speculative accumulation—have skyrocketed in the past two months. “The amount of BTC acquired in the last 2 months by this cohort has completely consumed all of the BTC unloaded by LTHs over the last 1.5 years,” he said. “Incredible.” This cohort’s aggressive accumulation, he added, has historically preceded bullish squeezes. “Whenever aggressive spikes in 6M+ holders occur, price usually squeezes following these periods. Short-term bullish,” Edwards remarked. However, he tempered the optimism by cautioning that broader on-chain data still signals fragility. “If the 6M+ holders (Treasury Companies) can continue their relentless buying, that should be achievable,” he noted, signaling that the flywheel has momentum, but is not yet immune to systemic pressure. Adding another layer to this developing narrative, Mauricio Di Bartolomeo, Co-founder and CSO at Ledn, offered an alternative theory. He suggested that what appears as two flows—LTHs selling and Treasury entities buying—might in fact be “the same trade.” He wrote, “Long term holders [are] selling spot to buy ETFs/BTC Treasury Cos. Even though that feels unnatural for us bitcoiners.” Di Bartolomeo framed the shift as generational, pointing out that many early adopters may simply be more comfortable in traditional financial custody rather than self-sovereign wallets. But Edwards pushed back on that explanation, arguing that if ETF migration was driving the reclassification of long-term holders, it would be evident across multiple aging cohorts. “I don’t think so because we would have seen a similar uptrend over time in the 6M+ and 1Yr+ cohorts if that was the case,” he replied. “Some is definitely moving to equities, but it’s very typical of this stage of the Halving cycle to see LTH selling into profit.” Why Bitcoin ETF Do Not Have A 1:1 Effect On Price The apparent dissonance between rising demand and stagnant price has also prompted commentary from on-chain analyst TXMC, who warned that most observers misunderstand what actually sets Bitcoin’s price. “Bitcoin people grossly underestimate how little of the supply is actually setting the price every hour,” he wrote. He described Bitcoin’s fragmented market structure as a web of siloed exchanges, loosely synchronized through cross-exchange market-making. “Each location has its own liquidity and depth which vary wildly. A large market order can have an outsized effect depending on which exchange it is placed at, and which time of day.” TXMC argued that while ETFs and institutional desks are accumulating large quantities of Bitcoin, much of this activity is routed through OTC desks that bypass order books entirely. “These actions do not affect the price in the same way,” he said. “The desks source their own liquidity, and only have to go into the books to fill the difference.” This explanation may help reconcile why ETF inflows in the billions of dollars have failed to push BTC significantly higher. Edwards’ thesis aligns with this too, insofar as the ETF boom may be fueling redistribution rather than outright net demand. TXMC added: “Stop underestimating how many big entities are out there looking for exit liquidity.” Despite growing bullishness in cohort composition, the real test lies ahead. Whether corporate treasuries and ETF managers can absorb the remaining exit waves of Bitcoin’s earliest holders remains to be seen. But if Edwards is right, the rotation may already be past its critical phase. “The flywheel still has a long way to go,” Edwards concluded. And if history is any guide, these moments of consolidation amid redistribution tend to precede volatility—not follow it. At press time, BTC traded at $108,044. -
The Bitcoin rainbow chart shows BTC ▼-0.16% cruising well above $100K and even on the cheap. Yet, 99Bitcoin’s analysis shows that USDT’s supply is peaking, and leveraged shorts are swelling, which are signs we could oscillate either way. Meanwhile, critiques of popular predictive models like economist Raoul Pal’s M2-Bitcoin correlation make us wonder, is this cycle different? Is the alt-season cancelled? (Rainbow Chart) Bitcoin Rainbow Chart: The Battle Between Bulls and Bears Bitcoin rebounded from a multi-month low of $98k, wiping out bearish positions priced on geopolitical fears. Currently trading near $108,952, BTC is consolidating within the $106k–$108k range as bulls eye a retest of the psychological $110k level. One thing to note: well-known trader James Wynn has a 40x short position, worth $1.49 million, that hinges on $108,630 as a key liquidation level. Wynn and other bearish traders could face a short squeeze if Bitcoin breaks above this zone. All of this could trigger a new BTC ATH and subsequent alt-season later in the summer. In a takedown posted June 24, he argued the model’s predictive power dissolves on contact with reality. The more you tweak it, the worse it gets. “It’s not forecasting but forcing a story onto the chart,” he said. Regardless, the next four months will show if we’re in a “traditional cycle” where Bitcoin goes bananas off of money printing, rate cuts, and geopolitical cooldown, or if Sina is right. What’s Next for Bitcoin? Blind faith in legacy Bitcoin models is fading. Analysts like Sina are urging a return to fundamentals: liquidity flows, wallet activity, and real-time network signals. Pack your bags, boys (and girls), the next few weeks may decide whether BTC breaks orbit or gets dragged back into chop. EXPLORE: Tether CEO Paolo Ardoino Hopes For Net Positive From US Elections, Says Bitcoin Strategic Reserve Is A Great Idea: 99Bitcoins Exclusive Join The 99Bitcoins News Discord Here For The Latest Market Updates Key Takeaways Critiques of popular predictive models like economist Raoul Pal’s M2-Bitcoin correlation are spreading All eyes are on Powell next month as inflation lingers and labor metrics soften. The post Bitcoin Rainbow Chart: The Next 4 Months For BTC Could Change Everything: Is History Repeating? appeared first on 99Bitcoins.
-
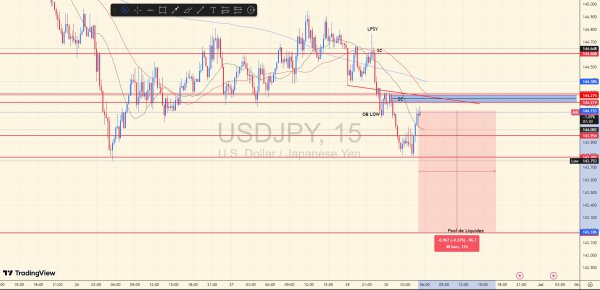 Perspectiva de análise Continuação de LPSY após orderBlock gerada através de (SELLING CLIMAX, SC). Em direção de retest Pool de Liquidez (CHoCH 12/06) Gerenciamento stoploss não deve ser maior que a última vela vermelha maior (LH) acima do SC.
 -
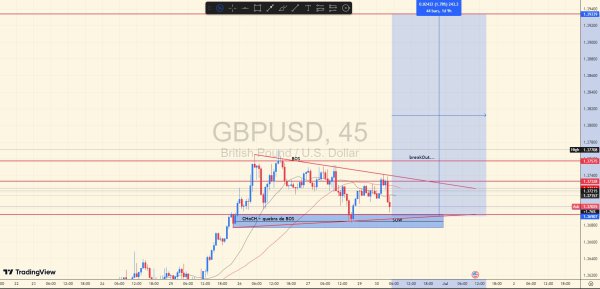
 Perspectiva de análise Quebra de BOS + CHoCH, continuação de tendência em criação descendente através de SOW para continuação em acumulação até a zona breakOut para retest/quebra em POOL DE LIQUIDEZ. Gerenciamento stoploss não se deve usar mais que a mínima da última baixa do SOW.
 -
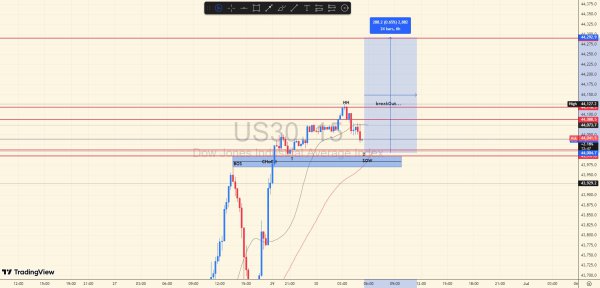
 Perspectiva de análise quebra de CHoCH + BOS em canal descendente, indicando continuação de tendência através de SOW para potencial quebra de HH (breakOut...) zona. Gerenciamento Stoploss não se deve usar mais que a minima da última baixa (HL) do SOW.
 -
Analyst Says Buying This Meme Coin Is A 3X Leveraged Play If Solana ETFs Go Live
um tópico no fórum postou Redator Radar do Mercado
As the crypto market looks toward a recovery and the likes of Solana make their way out of losses, a crypto trader has called out one meme coin that could be a great play as the SOL price recovers. The BONK meme coin, currently the largest meme coin in the Solana ecosystem and billed for triggering the revival of the blockchain, continues to receive a lot of support as a meme coin that could outperform as the market ushers in the next altcoin season. Solana’s BONK Meme Coin Is The Play Crypto analyst and trader Unipcs became popular in crypto circles on the social media platform X (formerly Twitter) after turning $16,000 into more than $10 million with a long BONK trade. Despite making what many have referred to as a life-changing trade, the trader has refused to close this trade, with the expectation that the meme coin will continue to rise. In a recent post, Unipcs has once again reiterated his support for the BONK meme coin and why he believes it’s a great play to be involved in. The post mainly points to bullish developments surrounding the Solana ecosystem and why BONK could be a way to maximize gains as the Solana price rallies. The first bullish development the crypto analyst points to is the fact that a Solana ETF is expected to hit the market soon. When this happens, the Solana price is expected to recover in response, possibly rising toward new all-time highs, something that would translate into more bullishness for meme coins domiciled on the blockchain. As for BONK, Unipcs explained that the meme coin acts as a 3X leveraged bet on the Solana price. This is because historically, the BONK price has often risen 3X higher than any gains that Solana puts in. Its highly volatile nature as a meme coin also contributes to this, as it is prone to rapid bursts of rising prices, the same way it is prone to quick crashes. Furthermore, the expectations of a Solana ETF being approved by the Securities and Exchange Commission (SEC) are not the only thing propelling the bullishness of BONK. BONK, itself, also has a pending ETF filing with the commission, and the approval of a Solana ETF increases the likelihood of a BONK ETF approval, giving the meme coin even more fuel to rally. Given these bullish factors, the crypto analyst believes that being in BONK could be a good play, especially as the price remains 75% below its all-time high. “Ff we do get Solana season soon, you do not want to be underexposed to BONK,” Unipcs said in closing. -
US equity markets continued their bullish climb on Friday, 27 June, defying renewed stagflation risks. Core PCE inflation for May rose to 2.7% y/y (above April’s 2.6% and consensus), while personal spending contracted -0.1% m/m—the first decline since January, highlighting the impact of tariffs and economic uncertainty on consumer demand. The S&P 500 (+0.5%) and Nasdaq 100 (+0.4%) both closed at fresh all-time highs, brushing off hawkish trade rhetoric from President Trump. He signalled plans to suspend negotiations with Canada ahead of the 9 July expiry of the 90-day tariff pause, citing retaliation for Canada’s digital services tax and threatening new levies this week. close Fig 2: Germany 30 CFD Index minor trend as of 30 June 2025 (Source: TradingView) Fig 2: Germany 30 CFD Index minor trend as of 30 June 2025 (Source: TradingView) Since its retest and bullish reversal on the 50-day moving average seen last Monday, 23 June 2025, the price actions of the Germany 30 CFD Index (a proxy of the German DAX futures) have transformed into a bullish impulsive up move sequence (see Fig 2). Watch the 23,770 short-term pivotal support (also the 20-day moving average) for the next intermediate resistances to come in at 24,260, and 24,560/24,600 (Fibonacci extension cluster) However, failure to hold above 23,770 invalidates the bullish tone to kick-start another minor corrective decline sequence to expose the next intermediate support at 23,510/23,440 (also the rising 50-day moving average) before another potential bullish reversal materializes. Opinions are the authors'; not necessarily that of OANDA Business Information & Services, Inc. or any of its affiliates, subsidiaries, officers or directors. The provided publication is for informational and educational purposes only. If you would like to reproduce or redistribute any of the content found on MarketPulse, an award winning forex, commodities and global indices analysis and news site service produced by OANDA Business Information & Services, Inc., please refer to the MarketPulse Terms of Use. Visit https://www.marketpulse.com/ to find out more about the beat of the global markets. © {CURRENT_YEAR} OANDA Business Information & Services Inc.
-
Top Analyst Predicts Major Ethereum Rally Toward $4,000 As Shorts Hit All-Time Highs
um tópico no fórum postou Redator Radar do Mercado
As the market’s second largest cryptocurrency, Ethereum (ETH), struggles to maintain momentum above the crucial $2,500 threshold, one analyst believes that ETH is poised for a significant rally. In a recent post on social media platform X (formerly Twitter), crypto analyst Cyclop expressed a bullish outlook, labeling the current market conditions as the best long setup for Ethereum he has seen in years. Analyst Sees $4,000 Target This Summer Cyclop highlighted that Ethereum short positions have reached all-time highs, a situation reminiscent of a previous spike that occurred just weeks ago. The analyst noted that liquidity has been swept on both sides, creating a scenario where market uncertainty may actually benefit Ethereum. “Most doubt ETH and altcoins right now—I’m betting on $4,000 this summer,” he stated confidently. Cyclop outlined several key factors driving his optimistic stance. First, he pointed to the recent Pectra update, which has reinvigorated interest in Ethereum by enhancing transaction capabilities, updating security features, and improving staking options. This update has reportedly led to increased demand, contributing to a potential price surge. Moreover, Cyclop emphasized the broader macroeconomic landscape, noting that cryptocurrency adoption is accelerating beyond Bitcoin (BTC), with Ethereum taking a prominent role. The analyst suggests that major corporations and banks are beginning to purchase and stake Ethereum, further boosting trust and interest in the digital asset which could ultimately result in more demand and more price uptrends. Ethereum Rallies May Trigger Altcoin Boom On-chain metrics also favor Ethereum, with the cryptocurrency ranking highly in various categories, according to Cyclop. It currently stands as the second-highest by fees, leads in bridged net flows, and ranks third in stablecoin supply changes, showcasing its robust market position. Another critical aspect of Cyclop’s analysis concerns altcoins and the upcoming altseason, traditionally characterized by a rush of investment into Ethereum before spilling over into smaller tokens. He pointed out that historical patterns indicate that Ethereum price rallies often trigger broader altcoin surges, and the current market sentiment suggests that many altcoins are at their lowest ebb. While Cyclop acknowledges that a majority of altcoins may face significant challenges, he argues that ETH remains undervalued, especially with Bitcoin trading near $100,000. He has made strategic moves, reallocating some of his Bitcoin holdings into Ethereum and promising strong altcoins. His initial target for Ethereum is $3,000, where he plans to take profits, followed by a series of sell orders between $4,000 and $6,000. As of press time, ETH trades at $2,500, a 12% price increase in the weekly time frame. Featured image from DALL-E, chart from TradingView.com -
Dogecoin (DOGE) Recovery Sees Uptick — But Lacks Follow‑Through at $0.168
um tópico no fórum postou Redator Radar do Mercado
Dogecoin started a fresh increase above the $0.160 zone against the US Dollar. DOGE is now consolidating and might aim for a move above $0.1680. DOGE price started a fresh increase above the $0.1520 and $0.160 levels. The price is trading above the $0.1620 level and the 100-hourly simple moving average. There is a key bullish trend line forming with support at $0.1650 on the hourly chart of the DOGE/USD pair (data source from Kraken). The price could start a fresh decline if it stays below the $0.1680 zone. Dogecoin Price Faces Resistance Dogecoin price started a fresh increase above the $0.1450 zone, like Bitcoin and Ethereum. DOGE was able to climb above the $0.1550 and $0.160 resistance levels. The bulls even pushed the price above the $0.1650 resistance. A high was formed at $0.1699 and the price is now consolidating gains above the 23.6% Fib retracement level of the upward move from the $0.1572 swing low to the $0.1699 high. Dogecoin price is now trading above the $0.1650 level and the 100-hourly simple moving average. There is also a key bullish trend line forming with support at $0.1650 on the hourly chart of the DOGE/USD pair. Immediate resistance on the upside is near the $0.1680 level. The first major resistance for the bulls could be near the $0.1720 level. The next major resistance is near the $0.1750 level. A close above the $0.1750 resistance might send the price toward the $0.180 resistance. Any more gains might send the price toward the $0.200 level. The next major stop for the bulls might be $0.2120. Another Drop In DOGE? If DOGE’s price fails to climb above the $0.1680 level, it could start another decline. Initial support on the downside is near the $0.1660 level or the trend line zone. The next major support is near the $0.1620 level and the 61.8% Fib retracement level of the upward move from the $0.1572 swing low to the $0.1699 high. The main support sits at $0.160. If there is a downside break below the $0.160 support, the price could decline further. In the stated case, the price might decline toward the $0.150 level or even $0.1450 in the near term. Technical Indicators Hourly MACD – The MACD for DOGE/USD is now losing momentum in the bullish zone. Hourly RSI (Relative Strength Index) – The RSI for DOGE/USD is now above the 50 level. Major Support Levels – $0.1650 and $0.1620. Major Resistance Levels – $0.1680 and $0.1800. -
XRP Price Springs Higher — Rally Reignited with Bullish Momentum
um tópico no fórum postou Redator Radar do Mercado
XRP price started a steady increase above the $2.120 zone. The price is consolidating and might aim for a move above the $2.220 resistance. XRP price started a fresh increase above the $2.20 zone. The price is now trading above $2.150 and the 100-hourly Simple Moving Average. There was a break above a bearish trend line with resistance at $2.190 on the hourly chart of the XRP/USD pair (data source from Kraken). The pair could gain bullish momentum if it clears the $2.220 resistance zone. XRP Price Eyes Fresh Surge XRP price formed a base above the $2.080 level and started a fresh increase, like Bitcoin and Ethereum. The price was able to climb above the $2.120 and $2.150 resistance levels. There was a break above a bearish trend line with resistance at $2.190 on the hourly chart of the XRP/USD pair. The pair even cleared the $2.20 level. A high was formed at $2.2191 and the price is now correcting gains. There was a move below the $2.20 level, but it is still above the 23.6% Fib retracement level of the upward move from the $2.070 swing low to the $2.2191 high. The price is now trading above $2.180 and the 100-hourly Simple Moving Average. On the upside, the price might face resistance near the $2.220 level. The first major resistance is near the $2.250 level. The next resistance is $2.320. A clear move above the $2.320 resistance might send the price toward the $2.350 resistance. Any more gains might send the price toward the $2.40 resistance or even $2.450 in the near term. The next major hurdle for the bulls might be $2.50. Downside Correction? If XRP fails to clear the $2.220 resistance zone, it could start another decline. Initial support on the downside is near the $2.180 level. The next major support is near the $2.1450 level or the 50% Fib retracement level of the upward move from the $2.070 swing low to the $2.2191 high. If there is a downside break and a close below the $2.1450 level, the price might continue to decline toward the $2.120 support. The next major support sits near the $2.080 zone. Technical Indicators Hourly MACD – The MACD for XRP/USD is now gaining pace in the bullish zone. Hourly RSI (Relative Strength Index) – The RSI for XRP/USD is now above the 50 level. Major Support Levels – $2.220 and $2.250. Major Resistance Levels – $2.1450 and $2.120. -
Bitcoin Price Surges Above $108,000: Analyst Predicts Potential Breakout To $150,000
um tópico no fórum postou Redator Radar do Mercado
The Bitcoin price has recently climbed back above the $108,000 mark, yet it struggles to surpass its current record of $111,800, creating a sense of uncertainty in the market. This persistent inability to break through has characterized the cryptocurrency’s performance in recent weeks, leaving analysts to speculate on its next moves. Analyst Predicts Major Upswing Crypto analyst Doctor Profit has outlined two potential scenarios for the Bitcoin price trajectory in the near term, offering insights into both immediate volatility and a long-term bullish outlook. In a recent post on social media platform X (formerly Twitter), Doctor Profit emphasized the significance of the current market conditions, suggesting that Bitcoin could reach between $120,000 and $150,000 in the coming months. According to Doctor Profit, the market is poised for a breakout. He noted, “We’re standing in front of a breakout, one that has the potential to send Bitcoin into the $120,000–$150,000 zone over the next few months.” This assertion is supported by data reflecting strong on-chain activity, favorable technical structures, liquidity flow, and macroeconomic factors. While the long-term outlook appears promising, he cautioned that short-term fluctuations will remain prevalent. Two Scenarios For The Bitcoin Price Doctor Profit outlined two primary outcomes that traders should consider. The first scenario involves a bullish breakout from a bull flag pattern, allowing Bitcoin to surge past the $113,000 resistance level and continue climbing without a pullback. However, the analyst views this scenario as overly simplistic, suggesting that market makers typically prefer not to allow such parabolic moves to occur without a preceding shakeout. The second scenario, which appears more likely, involves either a rejection at the bull flag breakout or a liquidity grab at the $113,000 mark. This would potentially lead Bitcoin to revisit the lower boundary of the current range, around $90,000 to $93,000. Doctor Profit noted that this region is attractive because it contains significant liquidity and a notable gap in the Chicago Mercantile Exchange (CME) futures market. He views a dip to these levels not as a bearish signal, but rather as an opportunity to accumulate more Bitcoin. In his analysis, he stated, “$93K is not bearish. It’s clearly a gift!.” Doctor Profit believes that this potential dip would not only reset market leverage but also shake out weaker hands, creating a more robust foundation for a subsequent rally. Macroeconomic Trends Favor BTC Looking at the long-term prospects, Doctor Profit highlighted that larger wallets continue to accumulate Bitcoin, indicating that major investors are positioning themselves for a significant upward movement. He pointed to macroeconomic indicators, particularly the M2 money supply, which suggests that Bitcoin remains undervalued relative to broader economic trends. Notably, the Bitcoin price has been trading within its current range for 226 days, which echoes patterns observed during previous accumulation phases before major price breakouts. As Doctor Profit concluded, the Bitcoin price trajectory remains optimistic, with expectations of reaching between $120,000 and $150,000 in the foreseeable future. He notes that while there are multiple paths to achieving this target, a dip into the $90,000 to $93,000 range would provide a crucial opportunity for accumulation and set the stage for a powerful upward move. Featured image from DALL-E, chart from TradingView.com -
Ethereum Price Tests Resistance — Breakout Could Spark Rally
um tópico no fórum postou Redator Radar do Mercado
Ethereum price started a fresh increase above the $2,480 zone. ETH is now consolidating gains and might soon aim for a move above the $2,520 resistance. Ethereum started a fresh upward move above the $2,450 level. The price is trading above $2,450 and the 100-hourly Simple Moving Average. There is a key bullish trend line forming with support at $2,440 on the hourly chart of ETH/USD (data feed via Kraken). The pair could start a fresh increase if it remains stable above the $2,420 zone in the near term. Ethereum Price Eyes More Gains Ethereum price started a fresh increase above the $2,420 support level, like Bitcoin. ETH price was able to clear the $2,450 and $2,480 resistance levels to move into a positive zone. The bulls even pushed the price above the $2,500 zone. However, the bulls were active above the $2,500 level. A high was formed at $2,523 and the price is now consolidating gains above the 23.6% Fib retracement level of the upward move from the $2,394 swing low to the $2,523 high. Ethereum price is now trading above $2,450 and the 100-hourly Simple Moving Average. There is also a key bullish trend line forming with support at $2,440 on the hourly chart of ETH/USD. On the upside, the price could face resistance near the $2,520 level. The next key resistance is near the $2,550 level. The first major resistance is near the $2,580 level. A clear move above the $2,580 resistance might send the price toward the $2,650 resistance. An upside break above the $2,650 resistance might call for more gains in the coming sessions. In the stated case, Ether could rise toward the $2,720 resistance zone or even $2,800 in the near term. Downside Correction In ETH? If Ethereum fails to clear the $2,520 resistance, it could start a fresh decline. Initial support on the downside is near the $2,480 level. The first major support sits near the $2,460 zone or the 50% Fib retracement level of the upward move from the $2,394 swing low to the $2,523 high. A clear move below the $2,460 support might push the price toward the $2,440 support. Any more losses might send the price toward the $2,400 support level in the near term. The next key support sits at $2,350. Technical Indicators Hourly MACD – The MACD for ETH/USD is gaining momentum in the bullish zone. Hourly RSI – The RSI for ETH/USD is now above the 50 zone. Major Support Level – $2,440 Major Resistance Level – $2,520 -
Bitcoin Price Uptrend Intact — Extension Likely if Momentum Holds
um tópico no fórum postou Redator Radar do Mercado
Bitcoin price started a fresh increase above the $107,500 zone. BTC is now consolidating and might aim for a move above the $108,800 resistance. Bitcoin started a fresh increase above the $107,500 zone. The price is trading above $107,500 and the 100 hourly Simple moving average. There is a bullish trend line forming with support at $107,600 on the hourly chart of the BTC/USD pair (data feed from Kraken). The pair could start a fresh increase if it stays above the $106,500 zone. Bitcoin Price Eyes More Gains Bitcoin price started a fresh increase above the $105,000 zone. BTC gained pace and was able to climb above the $105,500 and $106,500 levels to enter a positive zone. The bulls pushed the price above the $107,500 resistance and the price tested the $108,800 zone. A high was formed at $108,792 and the price is now consolidating gains above the 23.6% Fib retracement level of the upward move from the $106,477 swing low to the $108,792 high. Bitcoin is now trading above $107,000 and the 100 hourly Simple moving average. There is also a bullish trend line forming with support at $107,600 on the hourly chart of the BTC/USD pair. On the upside, immediate resistance is near the $109,800 level. The first key resistance is near the $109,200 level. A close above the $109,200 resistance might send the price further higher. In the stated case, the price could rise and test the $110,000 resistance level. Any more gains might send the price toward the $112,000 level. Downside Correction Reaction In BTC? If Bitcoin fails to rise above the $108,800 resistance zone, it could start another decline. Immediate support is near the $107,800 level. The first major support is near the $107,500 level and the trend line. The next support is now near the $107,200 zone and the 61.8% Fib retracement level of the upward move from the $106,477 swing low to the $108,792 high. Any more losses might send the price toward the $106,500 support in the near term. The main support sits at $105,500, below which BTC might gain bearish momentum. Technical indicators: Hourly MACD – The MACD is now gaining pace in the bullish zone. Hourly RSI (Relative Strength Index) – The RSI for BTC/USD is now above the 50 level. Major Support Levels – $107,500, followed by $107,200. Major Resistance Levels – $108,800 and $110,000. -
Mercado de Treasuries encerra melhor semestre desde 2019 e aposta em cortes do Fed a partir de julho Análise Premium Por Igor Pereira, Analista de Mercado Financeiro – ExpertFX School Membro Junior WallStreet NYSE Mesmo após enfrentar um primeiro semestre repleto de volatilidade e choques políticos e geopolíticos, o mercado de títulos do Tesouro dos Estados Unidos (Treasuries) surpreendeu positivamente, encerrando o melhor desempenho semestral em cinco anos. A recuperação foi consolidada por uma sequência de três semanas consecutivas de ganhos, com investidores agora se posicionando para uma possível nova perna de valorização — especialmente com o relatório de empregos de junho, que será divulgado antes do feriado de 4 de julho. Segundo dados da LSEG Workspace, os Treasuries registraram o melhor retorno mensal desde fevereiro, com o rendimento da nota de 10 anos próximo de 4,28%, em mínimas de dois meses, refletindo o otimismo renovado com a possibilidade de cortes de juros ainda em 2025. Pressões do primeiro semestre O desempenho positivo ocorreu mesmo diante de uma série de fatores adversos: Políticas fiscais e comerciais imprevisíveis do governo Trump, Ameaças tarifárias renovadas com prazo até 9 de julho, Conflitos geopolíticos e O rebaixamento da nota de crédito soberana dos EUA pela Moody’s. Ainda assim, os investidores se mostraram resilientes, impulsionados pela expectativa de que o Federal Reserve corte juros pelo menos duas vezes até o final do ano, com apostas já se estendendo para um ciclo mais agressivo em 2026. Posição técnica e fluxos institucionais Opções de juros estão mostrando forte atividade, indicando apostas tanto em quedas de rendimento quanto em uma aceleração do ciclo de afrouxamento monetário; Os gestores estão preferindo papéis com prazo entre 5 e 10 anos, que se beneficiam mais intensamente em ciclos de corte de juros; Leitura do mercado aponta para quase 20% de chance de corte já em julho, e probabilidade próxima de 100% para setembro. A precificação é reflexo direto das expectativas quanto ao relatório de empregos de junho: o mercado projeta criação de 113 mil postos de trabalho, abaixo dos 139 mil do mês anterior, e taxa de desemprego subindo para 4,3% — o nível mais alto desde 2021. Divergência dentro do Fed e risco de erro de política A comunicação do Federal Reserve segue fragmentada: enquanto o presidente Jerome Powell adota postura cautelosa, aguardando clareza nos dados antes de cortar, parte do mercado teme que o banco central esteja ficando atrás da curva, sobretudo se os dados de inflação e emprego continuarem enfraquecendo. Segundo Jamie Patton, do TCW Group, “há mais de uma dúzia de pilotos no cockpit, todos discordando sobre a altitude da chegada”, o que eleva o risco de erro de política monetária. A gestora prefere títulos de 2 e 5 anos, que respondem com mais intensidade a mudanças rápidas nos juros. Expectativas das grandes instituições Bank of America espera que o rendimento de 2 anos feche 2025 em 3,75% e o de 10 anos em 4,50% — próximo dos níveis atuais; JPMorgan projeta que o Fed só cortará em dezembro, seguido por três cortes adicionais em 2026, com o rendimento de 10 anos em 4,35% até o final do ano; Morgan Stanley é mais dovish: vê o rendimento do Treasury de 10 anos caindo para 4% ainda em 2025 e chegando a 3% até o fim de 2026, com cortes agressivos no próximo ano. O que esperar O payroll de junho será decisivo para definir a probabilidade de corte já em julho. Um número mais fraco pode destravar as apostas para um alívio monetário imediato, enquanto um dado mais forte pode forçar o Fed a aguardar até setembro, mantendo o mercado em compasso de espera. Ao mesmo tempo, as incertezas fiscais, as negociações comerciais da Casa Branca e a fragmentação dentro do comitê de política monetária (FOMC) mantêm o ambiente carregado e sujeito a reprecificações bruscas. 🟨 Impacto do Mercado de Treasuries no XAU/USD (Ouro) 1. Correlação inversa ouro vs. yields dos Treasuries O ouro (XAU/USD) possui uma correlação inversa com os rendimentos (yields) dos Treasuries, especialmente os títulos de 10 anos (US10Y): Quando os yields caem, o custo de oportunidade de manter ouro (que não paga juros) diminui, o que aumenta sua atratividade; Quando os yields sobem, o ouro tende a corrigir, já que os investidores migram para ativos que oferecem rendimento real ajustado. 🟡 Situação atual: Com os yields em queda e expectativas crescentes de corte de juros pelo Fed, o ambiente torna-se favorável para o ouro, sobretudo como proteção contra desaceleração e incerteza monetária. 2. Expectativa de cortes de juros: catalisador altista para o ouro O mercado está precificando ao menos dois cortes de juros até o final de 2025, com possibilidade de antecipação para julho, caso o payroll decepcione. Isso: Desvaloriza o dólar no médio prazo; Reduz os rendimentos reais dos Treasuries (considerando inflação), o que fortalece o XAU/USD; Estimula fluxo institucional para ativos alternativos, como ouro e criptomoedas, em busca de proteção e diversificação. 📈 Resultado potencial para o XAU/USD: Cenário altamente construtivo no médio prazo, com potencial de buscar novamente a zona de US$ 3.400 a US$ 3.450, caso os dados do payroll confirmem fraqueza. 3. Fator de incerteza fiscal e política de Trump Com Donald Trump pressionando por nova rodada de cortes de impostos e ampliando o déficit fiscal, e com o rebaixamento da nota de crédito dos EUA pela Moody’s: A confiança no dólar e nos Treasuries como reserva de valor começa a enfraquecer; O ouro se torna refúgio de longo prazo institucional para bancos centrais, fundos soberanos e grandes gestoras; A acumulação estratégica de ouro por China, Índia e bancos centrais emergentes deve continuar, sustentando o preço. 4. Cenário técnico atual do ouro (XAU/USD) Suporte principal: US$ 3.180 Zona de defesa crítica: US$ 3.050 Resistência chave: US$ 3.400 Média de 50 dias foi perdida, indicando fraqueza no curto prazo, mas volatilidade implícita (GVZ) está baixa, abrindo espaço para reversão caso o payroll seja fraco. 📌 Estratégia recomendada: Para swing traders: considerar call spreads de 1 mês caso o ouro reaja positivamente ao payroll; Para proteção: puts de curto prazo (US$ 3.200) continuam baratos e são úteis caso yields revertam temporariamente. 📊 Conclusão: O que esperar para o XAU/USD O ouro está em modo de espera técnica, pressionado no curto prazo, mas fundamentalmente apoiado por três pilares: Expectativas crescentes de corte de juros; Incerteza fiscal e geopolítica dos EUA; Acumulação estrutural por bancos centrais e investidores institucionais. Se o payroll desta semana vier fraco, o XAU/USD pode reverter a correção atual e buscar novas máximas. Caso venha forte, pode testar os US$ 3.180 com risco ampliado até US$ 3.050 antes de retomar o movimento de alta. Opinião do analista Igor Pereira A performance do mercado de Treasuries no primeiro semestre mostra o poder de reação dos fluxos institucionais diante de incertezas. A tese de “duration trade” continua forte: quanto mais sinais de desaceleração econômica e inflação controlada, maior a justificativa para antecipar cortes de juros. No cenário atual, considero atrativa a exposição tática em títulos entre 5 e 10 anos, bem como a montagem de estruturas com opções de juros. O payroll desta quinta-feira será o divisor de águas: dados mais fracos podem destravar uma rotação completa nos rendimentos, com busca acelerada por duration até o final do verão americano. O risco central permanece na comunicação do Fed: uma postura excessivamente atrasada pode forçar o banco a cortar de forma mais agressiva em 2026, elevando o risco de um pouso forçado.
- Yesterday
-
In Friday’s White House press conference, Donald Trump yet again declared his support for Bitcoin, calling it ‘amazing’ and pointing out its growing use in the economy. It has become amazing. I mean, it is the jobs that it produces, and I notice more and more you pay in Bitcoin. People are saying it takes a lot of pressure off the dollar, and it is a great thing for our country. – Donald Trump in latest White House speech In this article, we’ll quickly touch upon Trump’s latest pro-crypto comments, how they could spark another altcoin rally, and what the best crypto to buy is if you wish to capitalize on the momentum before the next leg up. Trump Says Bitcoin is Relieving Dollar Strain Easily the most notable piece of Trump’s speech was his claim that Bitcoin is relieving pressure off the US dollar. This is ‘a much more significant statement than what it seems at first glance,’ says digital asset researcher Anders. According to Anders, Trump’s comment suggests he understands the ‘Triffin dilemma,’ which is a long-standing economic paradox, and that he’s probably keen on using crypto to solve it. The Triffin dilemma is the term used to describe the conflict faced by the country (in this case, the USA) whose currency (the US dollar) serves as the world’s reserve currency. The ‘dilemma’ is that while the US dollar becomes stronger by boosting its global demand, this very strength then widens the country’s trade deficit. A stronger dollar makes imports cheaper and exports become more expensive. Using a cryptocurrency like Bitcoin – or XRP, which is a more ‘US-made’ crypto than $BTC – could help ease pressure on USD. If investments flow in the form of $BTC rather than $USD, it would reduce demand for the dollar, weakening it and, therefore, correcting the trade deficit. All in all, Trump’s renewed endorsement adds momentum to the crypto narrative. It positions Bitcoin (and potentially other tokens) as a genuinely strategic financial tool. With that in mind, here are a few cryptos that could benefit from Bitcoin’s latest tap on the shoulder. 1. BTC Bull Token ($BTCBULL) – Best Crypto to Buy Now, Offering Free $BTC Airdrops BTC Bull Token ($BTCBULL) is one of the best cryptos to invest in right now because, first and foremost, it’s the ONLY one offering free $BTC to its token holders. Buy $BTCBULL and store it in Best Wallet, and whenever Bitcoin crosses $150K and $200K for the first time, you’ll automatically receive your share of free $BTC. Additionally, holding BTC Bull Token will also beef up your crypto portfolio. That’s because the token is predicted to surge 277% and reach $0.0096 by 2026. One $BTCBULL is currently priced at just $0.00258, and the project has in total raised over $7.6M (and counting) in early investor funding. Another reason for this new crypto’s potential bright future is its token burn mechanism. Simply put, the developers will shave off a part of the total token supply with rising Bitcoin prices. This will create artificial scarcity and upward price pressure, especially during Bitcoin bull runs. It’s a clever way of aligning the token’s growth with Bitcoin’s momentum. 2. Bitcoin Hyper ($HYPER) – Putting the Bitcoin Blockchain on Steroids Bitcoin is undoubtedly the OG crypto and blockchain, but it wasn’t really built with Web3 adoption in mind. It only processes seven transactions per second, as opposed to Solana’s 2K-3K TPS. Enter Bitcoin Hyper ($HYPER). This new meme coin on presale aims to build the first-ever Layer 2 on Bitcoin that will directly tackle the problems of scalability and programmability on the network. By leveraging a Canonical Bridge and integrating the Solana Virtual Machine (SVM), it will convert your $BTC from a traditional L1 asset into a high-speed, scalable L2 asset. You’ll be able to use this ‘wrapped’ Bitcoin on L2 for lightning-fast payments and swaps, as well as lending and staking on DeFi apps, NFT platforms, and gaming dApps. Also, according to our Bitcoin Hyper price prediction, the token could be the next crypto to explode. It could reach $0.253 by 2030 – a nearly 2,000% gain from current prices. $HYPER is currently in presale, which is why you can buy it for a low price of $0.012075. Even though the presale is fresh out of the oven, it has amassed a chunky $1.7M so far. Here’s how to buy it. 3. Useless Coin ($USELESS) – Viral New Meme Coin with No Intrinsic Value or Utility Useless Coin ($USELESS) is the newest and perhaps the perfect epitome of what meme coins truly stand for: community-driven degen fun without any real utility or intrinsic value. With no staking, governance mechanisms, or revenue generation outside liquidity fees, $USELESS is almost a satirical take on all the other so-called utility tokens flooding the market right now. It launched just over a couple of weeks ago and has already gained over 92%. Currently trading at $0.1665, $USELESS is hitting new all-time highs as we speak, so this might be a good time to get in. Wrapping Up With Donald Trump’s latest remarks on Bitcoin signaling renewed support for the crypto world, high-potential newcomers like BTC Bull Token ($BTCBULL) and Bitcoin Hyper ($HYPER) can surge big time. That said, keep in mind that investments in crypto are highly risky. This article isn’t financial advice, so only invest after doing your own research.
-
Bitcoin Spot ETFs Register $2 Billion Inflows As Institutional Demand Surges – Details
um tópico no fórum postou Redator Radar do Mercado
The US Bitcoin spot ETFs logged over $2 billion in net inflows last week, marking a three-week streak of positive momentum. Despite a bearish start to June, with $128.81 million in net outflows during the first trading week, investor appetite soon quickly rebounded. This turnaround has resulted in a cumulative $4.63 billion in deposits over the past three weeks. Bitcoin ETFs On Impressive 14-Day Positive Streak Despite Market Uncertainty On Friday June 27, the 12 US Bitcoin ETFs registered net inflows of $501.27 million bringing the aggregate deposits of the last week to a staggering $2.22 billion. According to data from ETF tracking site SoSoValue, the clean streak of daily inflows from last week extends the ETFs’ positive performance to 14 consecutive days. In analyzing individual ETF data from this week, the BlackRock IBIT registered $1.31 billion in net deposits solidifying its position as the market’s unrivalled leader. Meanwhile, Fidelity’s FBTC and Ark/21 Shares’ ARKB also experienced substantial cumulative inflows of $504.40 million and $268.14 million, respectively. Grayscale’s BTC, VanEck’s HODL, Valkyrie’s BRRR, Invesco’s BTCO, and Franklin Templeton’s EZBC also recorded moderate net flows ranging from $1million – $25 million. In familiar fashion, Grayscale’s GBTC produced the only net outflows losing $5.69 million in withdrawals, but still retains its position as the third largest Bitcoin ETF with $19.79 billion in net assets. Following this week, the US Bitcoin Spot ETFs have now recorded $4.50 billion in net flows in June signaling a resolute demand from institutional investors despite Bitcoin market troubles. Notably, the premier cryptocurrency has witnessed extensive corrections since hitting a new all-time high of $111,790 on May 22. Over the last month, BTC has made no new price discovery trading largely between $100,000 and $110,000 to form a descending price channel. While this price performance reflects a neutral market sentiment, the high influx of capital into the Bitcoin ETFs signal a long-term confidence by institutional investors on Bitcoin’s price appreciation prospects. Ethereum ETFs Log $283 Million In Deposit To Close Out H1 2025 In other developments, SoSoValue data also reveals that US Ethereum Spot ETFs notched up a cumulative inflow of $283.41 million over the last week extending their positive streak to seven consecutive weeks. In June alone, these ETFs saw total inflows of $1.13 billion, marking their largest monthly gain in 2025. As of the time of writing, the total net assets of the Ethereum ETFs stand at $9.88 billion, accounting for 3.37% of Ethereum’s market capitalization. Meanwhile, Ethereum continues to trade at $2,441 with Bitcoin prices set around $107,339.