

Todas Atividades
Atualizada automaticamente
- Recentemente
-

USDJPY tests the extremes of its range in a calm Forex session
um tópico no fórum postou Redator Radar do Mercado
Good morning for the North-American readers and nice start to the week to everyone. The ongoing Forex session is a very calm one, as most traders brace for the upcoming US CPI data release tomorrow, with the most moving currency in the day being the AUD and NZD seeing some selling. France is also celebrating their National Day! (Bonne fête aux compatriotes !) Other markets have however seen some movements: the Singapore STI has been making records highs on its 6th consecutive sessionBitcoin hit highs of $123,000Orange Juice Futures are squeezing again (up above 18% on the session, +50% since July) Let's prepare for tomorrow's huge number by taking a look at where we stand in the current range in USDJPY as the pair has also been rising strongly in the past two weeks. Read More: Markets weekly outlook - Inflation Storm Ahead as Earnings Season Gets Underway Opinions are the authors'; not necessarily that of OANDA Business Information & Services, Inc. or any of its affiliates, subsidiaries, officers or directors. The provided publication is for informational and educational purposes only. If you would like to reproduce or redistribute any of the content found on MarketPulse, an award winning forex, commodities and global indices analysis and news site service produced by OANDA Business Information & Services, Inc., please refer to the MarketPulse Terms of Use. Visit https://www.marketpulse.com/ to find out more about the beat of the global markets. © {CURRENT_YEAR} OANDA Business Information & Services Inc. -
Silver price surges to 14-year high amid mounting trade tensions
um tópico no fórum postou Redator Radar do Mercado
Silver price rose 1.6% to $38.96 per ounce on Monday, its strongest level since September 2011, as investors flocked to safe-haven assets amid escalating US trade tensions. The spike followed President Donald Trump’s announcement of 30% tariffs on most imports from the European Union and Mexico, boosting demand for non-rate-sensitive commodities. Mexico is also the largest producer of silver and a key supplier to the American market. Analysts say the rally is driven by speculative flows, with silver moving above key technical resistance levels as traders bet on further gains. ANZ noted that breaching the $35–$37 range could propel silver prices toward $40 per ounce. Market outlook Participants are also eyeing US consumer price index and producer price index readings due later this week for signals on Federal Reserve policy, given silver’s tendency to benefit in a lower-rate environment. In addition, Indian investors, traditionally heavy buyers of gold, have increasingly turned to silver this year as its returns outpaced those of gold. The rise in appetite for the metal has left the physical market under strain in London, where most silver is held by exchange-traded funds — meaning it isn’t available to lend or buy. Since February, the volume of silver-backed ETFs has expanded by some 2,570 tons, according data compiled by Bloomberg. Silver’s outperformance of gold means that the ratio between the two has dropped in recent months, though silver still remains relatively cheap historically. It currently takes about 86 ounces of silver to buy 1 ounce of gold, compared with a 10-year average of 80. “Silver demand is currently benefiting from the threat of trade wars and bullion being way out of reach for many,” Priyanka Sachdeva, an analyst at Phillip Nova Pte Ltd, told Bloomberg. “Gold has already seen a tremendous upswing, and it’s currently expensive,” leaving investors more inclined to consider a cheaper alternative, she added. Silver ETF inflows at record pace Silver has emerged as one of the most attractive investment assets of 2025, with funds flowing into exchange-traded products (ETP) backed by the metal already surpassing all of last year, says the Silver Institute. During the first half of 2025, silver-backed ETPs saw net inflows totalling 95 million oz., taking the total global holdings to 1.13 billion oz. — only 7% below the peak level of 1.21 billion oz. in February 2021, according data compiled by the Institute. The total value of ETP holdings hit a series of all-time highs in June, exceeding $40 billion for the first time. Nearly half of the year’s gains were recorded in that month alone. By month-end, the metal’s price had gone up by a quarter for the year. The Silver Institute notes that June 2025 was the most significant monthly increase since the Reddit-driven silver squeeze in early 2021, when prices leaped to nearly $30 an ounce. (With files from Reuters and Bloomberg) -
The Australian dollar has edged lower on Monday. In the North American session, AUD/USD is trading at 0.6555, down 0.32% on the day. The Aussie took advantage of US dollar weakness last week as it touched a high of 0.6593, its highest level since November 2024. China's GDP expected to ease to 5.1%China's economy is expected to have grown by 5.1% in the second quarter, after back-to-back quarters of gains of 5.4%. The government's annual growth target is around 5.0%, and policymakers won't complain if this target is exceeded for a third consecutive quarter. Opinions are the authors'; not necessarily that of OANDA Business Information & Services, Inc. or any of its affiliates, subsidiaries, officers or directors. The provided publication is for informational and educational purposes only. If you would like to reproduce or redistribute any of the content found on MarketPulse, an award winning forex, commodities and global indices analysis and news site service produced by OANDA Business Information & Services, Inc., please refer to the MarketPulse Terms of Use. Visit https://www.marketpulse.com/ to find out more about the beat of the global markets. © {CURRENT_YEAR} OANDA Business Information & Services Inc.
- Hoje
-
Bitcoin Ignites Intraday Optimism With A Step Past $119,000 Threshold
um tópico no fórum postou Redator Radar do Mercado
Shaco AI, in a fresh update, highlighted that Bitcoin is showing off its moves, dancing upwards past both the 25-hour ($119,088.50) and 50-hour ($118,338.56) Simple Moving Averages. With such momentum, it’s clear BTC has decided it’s not a bear season yet. Momentum And Indicators Shaco AI’s analysis on Bitcoin dives deep into the technical indicators, and there’s no shortage of bullish energy in the air. First off, the Relative Strength Index (RSI) is currently riding high at 86.02. That’s well into overbought territory, and as Shaco colorfully put it, “it might need to hydrate soon.” Such elevated RSI levels often signal a potential cooldown on the horizon, but for now, momentum is favoring the bulls. Adding fuel to the trend is the Average Directional Index (ADX), which sits at a robust 44 points. According to Shaco AI, this reading confirms that the current uptrend is strong and well-supported. The MACD (Moving Average Convergence Divergence) indicator is also reinforcing this bullish narrative, with a reading of 967.98. Shaco described it as “screaming positive vibes,” a signal that buying pressure continues to dominate. A rising MACD in conjunction with a strong ADX often paints a picture of confident market participants driving the trend with conviction. One of the most telling signs is volume. Shaco pointed out that Bitcoin’s trading volume has surged to 2704.5, a significant leap above its average of 856.81. He described this as “some serious weight lifting in buying interest,” underscoring that this isn’t a weak or speculative move — traders are putting real capital behind the rally. Support And Resistance: Bitcoin Make-Or-Break Levels The analyst went further to highlight key levels traders should closely monitor. He noted, “Key Levels Alert: Keep an eye on the resistance at $122,666.0 and support sitting firm at $116,900.05. It feels like Bitcoin is playing ‘The Floor is Lava’ with support levels!” This colorful analogy points to the importance of holding key support to maintain bullish momentum. According to Shaco AI, if Bitcoin can sustain a move above the current resistance zone, traders might want to watch for a potential breakout. However, with the RSI already deep in overbought territory, there’s also the possibility that BTC may “peak too soon,” leading to a pullback or brief consolidation phase. He wrapped up the post with a reminder that while momentum is clearly favoring the bulls, it’s essential to stay cautious. “Always make well-informed decisions and manage your risk carefully,” the analyst advised, reinforcing the importance of strategic planning in a volatile market. -
Satoshi Nakamoto is New World’s Richest Person at This BTC Price
um tópico no fórum postou Redator Radar do Mercado
What if—and stay with us—infamous Bitcoin plagiarist Craig Wright actually was Satoshi Nakamoto? Yeah, no. Absolutely not. Creator of BTC ▲3.60% Satoshi Nakamoto, whoever he, she, or they are, just cracked the top 11 richest humans on Earth. Thanks to Bitcoin blowing past $120,000, Nakamoto’s legendary stash of 1.096 million BTC is now worth north of $131 billion, according to Arkham Intelligence. That puts the anonymous founder ahead of Dell CEO Michael Dell and legacy financiers alike. Here’s how much higher BTC needs to climb to put Satoshi at number one: BitcoinPriceMarket CapBTC$2.43T24h7d30d1yAll time DISCOVER: 9+ Best High-Risk, High-Reward Crypto to Buy in July 2025 Bitcoin Would Need to Hit $370,000 for Nakamoto to Top Forbes’ Billionaire List To claim the top spot, Nakamoto would need BTC to reach around $370,000, a 208% climb from today’s levels. That would nudge him past Elon Musk, who currently holds the #1 title with an estimated $404 billion fortune. “If Bitcoin does its normal 50%/ann, Nakamoto will likely climb to number two sometime next year-ish.” – Eric Balchunas, Bloomberg As for Satoshi they haven’t had one transaction in over a decade. Whether that’s out of principle or they’re no longer with us (RIP?), the silence has become part of the message. EXPLORE: XRP Price Jumps 11% After SEC Crypto Unit Tease XRP ETF Progress Key Takeaways Thanks to Bitcoin blowing past $120,000, Nakamoto’s legendary stash of 1.096 million BTC is now worth north of $131 billion. Momentum for BTC remains strong, with several analysts offering bullish but varied predictions. The post Satoshi Nakamoto is New World’s Richest Person at This BTC Price appeared first on 99Bitcoins. -
Could Crypto Week USA See President Trump’s WLFI Crypto Token Go Live For Trading
um tópico no fórum postou Redator Radar do Mercado
With crypto regulation garnering significant attention and Bitcoin surpassing $120,000, speculation is growing that President Trump’s World Liberty Financial DeFi project may decide to make its WLFI crypto token available for trading. Politicians in the US have dubbed this week ‘Crypto Week USA’ due to the three pivotal pieces of digital asset legislation set to be discussed in the House of Representatives this week. The three legislations up for discussion are the GENIUS Act, CLARITY Act, and Anti-CBDC Surveillance State Act. In terms of significant investments in WLFI crypto, the mysterious Aqua 1 Foundation, based in the UAE, is the highest-profile known investor. In late June, it was announced that Aqua 1 had purchased $100 million worth of WLFI crypto tokens, becoming the largest publicly known investor in the business. However, a review of corporate registries shows that Aqua 1’s digital profile and other public information are almost non-existent. There has been no further information regarding the source of its capital or the person it named as its founding partner, Dave Lee. “At this stage, we are not disclosing additional information beyond what has been publicly shared,” Aqua 1 said in a press release, before adding, “Aqua 1 is backed by a group of long-term, mission-aligned partners and led by Dave Lee and a global team with deep expertise in web3 and digital asset infrastructure.” EXPLORE: 20+ Next Crypto to Explode in 2025 Join The 99Bitcoins News Discord Here For The Latest Market Updates The post Could Crypto Week USA See President Trump’s WLFI Crypto Token Go Live For Trading appeared first on 99Bitcoins. -
Fibonacci Maps Dogecoin Path To $23—Is It Too Far-Fetched?
um tópico no fórum postou Redator Radar do Mercado
The Dogecoin weekly structure is once again the talk of Crypto-Twitter after pseudonymous technician Cantonese Cat (@cantonmeow) published a logarithmic Fibonacci road-map for the meme-coin’s fourth bull cycle. The chart, built on TradingView and shared on 13 July, anchors the entire 2021–2022 range and projects both horizontal retracement levels and upward-sloping Fib-channels, offering a granular set of targets. Dogecoin To $23? At Friday’s close DOGE changed hands near $0.20, almost exactly against the 0.5 retracement line, highlighted on the graphic at $0.19049. The overlay shows price compressing inside a three-year ascending channel whose lower rail has provided support since the June 2022 capitulation. Volatility has been fading inside that corridor, shaping a broadening wedge that has so far respected every golden-ratio diagonal printed on the chart. Cantonese Cat’s horizontal grid begins with the cycle floor—Fib 0 at $0.04909—and climbs through a dense cluster of intermediate resistances: 0.618 at $0.26232, 0.707 at roughly $0.33, 0.786 at $0.41368 and 0.886 at $0.54253. The 1.0 line—Dogecoin’s May 2021 macro-top—is fixed at $0.73905 and forms the upper boundary of what the analyst calls “the first liquidity wall.” Above it, blue extensions extend far beyond previous cycle extremes: 1.272 at $1.54518, 1.414 at $2.27089 and 1.618 at $3.94842. Super-cycle projections appear at 2.0 ($11.12397) and the headline-grabbing 2.272 extension at $23.25744—levels the trader himself stresses are “purely imaginative unless unprecedented liquidity flows in.” Golden channels running diagonally across the whole canvas translate the same ratios into time-adjusted dynamic support and resistance. Internal rails marked 0.236 and 0.382 have repeatedly capped minor rallies since mid-2022, while the 0.5 diagonal is now acting as an inflection point underneath spot price. The current weekly candle is probing that rail from above, echoing the analyst’s separate Ichimoku view that DOGE is “still under Tenkan resistance” and “will probably close the week right around 20 cents, then fight another day to push through resistance later. I don’t think we’ll get past this level on its first try.” The longer-term backdrop that keeps the feline strategist constructive is visible on the two-month chart. There, DOGE has printed what fellow technician @ManehattanStonk labels a “rising three methods” formation—a bullish continuation pattern that Cantonese Cat notes is “playing out alongside XLM.” Volume dynamics appear to support the thesis: in another post the analyst calls recent selling “pathetic” and argues: “Who’s selling DOGE? Nobody important. Sell volume’s pathetic. All it takes is just some volume to come in and this thing will pump to the moon.” Whether that pump can realistically reach the 2.272 extension—and thus the meme-laden target of $23—is the question that triggered the thread. Cantonese Cat’s answer is blunt: “I don’t think it’s going to $23 this cycle.” The comment underscores his broader point that Fibonacci projections, while mathematically neat, are ultimately hostage to liquidity conditions no one can forecast. The $3.94 region—marked by the 1.618 Fibonacci extension—stands out as a credible upside target. Analyst Kevin notes that in every previous bull cycle, Dogecoin ultimately advanced to this very extension. At press time, DOGE traded at $0.20575. -
Bitcoin Booms, and So Does Bitcoin Hyper — $2.5M Raised as Investors Bet on $BTC L2
um tópico no fórum postou Redator Radar do Mercado
Bitcoin has just surpassed the $120K mark, signaling a strong return of investor confidence. As capital flows beyond Bitcoin, altcoins are seeing a sharp rise in interest. Investors are betting big on early-stage projects, in particular, for their explosive potential in bullish markets. One standout is Bitcoin Hyper ($HYPER), which has already raised over $2.7M in its token presale. The project’s Layer-2 infrastructure attracts attention for its capacity to make Bitcoin faster, more scalable, and more functionally competitive. The Bitcoin Rally Is On, But Functionality Still Lags The current Bitcoin rally didn’t happen overnight. The bullish story has been building over the past few months, steadily supported by ETF applications from major players, crypto regulations turning positive, and changing macroeconomic sentiments. $BTC is doing what it does best. Time and again, it proves its worth as a store of value, emphasising that investors shouldn’t take the broader crypto market lightly. But Bitcoin’s capabilities still fall short. Running decentralized apps or scaling transactions on Bitcoin’s main chain continues to be difficult, both technically and financially. This is where Bitcoin Hyper comes in. Rather than treating Bitcoin as sacrosanct, it introduces a Layer-2 solution designed to work with the network. Not around it. What Is Bitcoin Hyper, and Why Are Investors Paying Attention? Bitcoin Hyper is building a Layer-2 blockchain for Bitcoin. The idea is simple. Let Bitcoin remain the secure foundation, while Bitcoin Hyper handles the transactions, the apps, and the ecosystem growth. Here’s what the project has in the works: Scalable transactions via a dedicated Layer-2 network. $BTC deposits and withdrawals through a canonical bridge. Solana Virtual Machine (SVM) integration to support fast, smart contract-enabled apps. A roadmap that includes full DeFi and NFT support, developer toolkits, and DAO governance. Bitcoin Hyper is currently in Phase 2 of its roadmap, with presale prices increasing in stages. $HYPER tokens can be staked, used for gas, and will eventually unlock exclusive ecosystem features. The tokenomics leans heavily toward development and infrastructure: 30% is allocated to project development, and another 30% to the treasury. Marketing and staking rewards follow, at 25% and 5% respectively. The project has also completed two independent security audits by blockchain security firms Coinsult and Spywolf. The audits confirmed that the coin meets industry standards for reliability and investor protection. Layer-2 Projects Are on the Move and $HYPER Is Tapping In Layer-2 tokens have been making serious moves in recent weeks. $ZKF has surged 84% in the past seven days, while $MAGIC is up 46%. Other notable performers like $LUMIA and $POL have also posted strong double-digit gains, reflecting growing investor interest in scalable blockchain infrastructure. Scalability is no longer optional. It’s a core part of blockchain’s next chapter. And for Bitcoin, which has never been known for speed or flexibility, Layer-2 is likely the way ahead. Given current market trends, $HYPER could reach around $0.02595 by the end of 2025. And assuming the project delivers on its white paper goals (like the mainnet launch, dApp support, and top exchange listings), it might climb as high as $0.253 by 2030. That would mark a return of over 20 times the initial presale price. The above Bitcoin Hyper ($HYPER) price prediction isn’t guaranteed, of course, but it is based on a fairly simple logic: if Bitcoin gains real utility at scale, the networks that provide it will benefit first. Why Timing Matters More Than Usual Bitcoin Hyper’s token presale is structured around timed price increases. As of now, $HYPER is priced at $0.01225, with the next increase set to trigger in just a few hours. Staking APY also declines over time, encouraging early participation. The presale traffic is growing as the $BTC rally fuels interest in the broader ecosystem. This isn’t just about a good idea. It’s about being early to infrastructure that could play a role in how Bitcoin evolves from a static asset into something developers and users can actually build on. Final Thoughts: Bitcoin’s Next Move is Layer-2 Bitcoin crossing $120K is more than just a milestone. It’s a signal that markets move in phases. While early gains often go to the safest assets, the next leg is likely to reward low-cap altcoins backed by breakthrough projects. Bitcoin Hyper is one of those projects. By bringing scalability and flexibility to Bitcoin through its Layer-2 infrastructure, it positions itself not as a competitor but as a necessary evolution of what Bitcoin can offer. The strong community engagement and presale traffic that’s already raised over $2.7M shows that investors are looking beyond the headline coins. If you’re considering early exposure to Bitcoin Hyper, visit the official presale website to learn more about the Layer-2 infrastructure and secure $HYPER tokens before the next price increase. New to presales? Be sure to read the How to Buy Bitcoin Hyper guide, and, as always, do your own research before making any crypto investment decisions. -
WTI Oil Advances as 200-day MA Serves as Support, Chinese Imports Soar
um tópico no fórum postou Redator Radar do Mercado
Most Read: Markets weekly outlook - Inflation Storm Ahead as Earnings Season Gets Underway Oil prices advanced this morning following a bullish close on Friday. It appears that the fears market participants had in regards to a recession may be waning and this has helped Oil prices. Economists now predict better growth, more jobs, a lower chance of a recession, and slower inflation compared to three months ago, according to The Wall Street Journal's quarterly survey. On average, economists see a 33% chance of a recession in the next year, down from 45% in April but higher than 22% in January. close Source: TradingView (click to enlarge) Source: TradingView (click to enlarge) Client Sentiment Data Looking at OANDA client sentiment data and market participants are long on WTI with 73% of traders net-long. I prefer to take a contrarian view toward crowd sentiment and thus the fact that so many traders are long means WTI prices could decline in the near-term. Follow Zain on Twitter/X for Additional Market News and Insights @zvawda Opinions are the authors'; not necessarily that of OANDA Business Information & Services, Inc. or any of its affiliates, subsidiaries, officers or directors. The provided publication is for informational and educational purposes only. If you would like to reproduce or redistribute any of the content found on MarketPulse, an award winning forex, commodities and global indices analysis and news site service produced by OANDA Business Information & Services, Inc., please refer to the MarketPulse Terms of Use. Visit https://www.marketpulse.com/ to find out more about the beat of the global markets. © {CURRENT_YEAR} OANDA Business Information & Services Inc. -
Bitcoin ETFs Log First-Ever Back-to-Back $1B+ Inflows, What’s Next For BTC Price?
um tópico no fórum postou Redator Radar do Mercado
For the second straight week, Bitcoin ETFs have absorbed over $1 billion in total inflows. Total holdings now exceed $150 billion showing that we’ve officially hit the coveted “banana zone.” Anything is possible in this market. Moreover, we’re seeing Wall Street’s crypto skepticism is collapsing in real time. The inflow spike comes as markets wobble on Fed policy and global uncertainty. BTC ▲3.60% is behaving like a pressure valve. BitcoinPriceMarket CapBTC$2.43T24h7d30d1yAll time DISCOVER: 9+ Best High-Risk, High-Reward Crypto to Buy This Year Bitcoin ETFs Hit $1 Billion for Second Straight Day The lion’s share of Friday’s $1.03 billion haul went to BlackRock’s IBIT, which raked in $953.52 million alone. Other notable inflows: Ark 21Shares’ ARKB: $23.51 million Grayscale’s Bitcoin Mini Trust: $20.93 million VanEck’s HODL: $20.01 million Bitwise’s BITB: $6.41 million Not a single fund posted outflows, marking six straight days of net-positive activity. With BTC at $122,000, now confirming a golden cross, we will likely see several new AThs this week. “Bitcoin has entered ‘crisis mode’… Rates are rising, the USD is down 11% in six months, and crypto is up $1 trillion in three months.” – Kobeissi Letter Bitcoin Price Hits New Highs, Traders Eye $135K–$145K Targets Bitcoin briefly topped $123,000, logging a $10,000 surge over the past week and fueling optimism that the bull run has room left to climb. According to Material Indicators co-founder Keith Alan, a long-term technical breakout is playing out. Trader sentiment remains bullish, with 99Bitcoins analysts forecasting more upside: Bitcoin is behaving like a full-fledged crisis hedge. With the US dollar sliding, inflation data looming, and debt exploding, investors are responding by piling into BTC. If ETF flows and technicals hold, $135K–$145K looks like the next price target. It might be an easier climb for Bitcoin to $500,000 than it was to $100,000. EXPLORE: XRP Price Jumps 11% After SEC Crypto Unit Tease XRP ETF Progress Key Takeaways For the second straight week, Bitcoin ETFs have absorbed over $1 billion in total inflows. It might be an easier climb for Bitcoin to $500,000 than it was to $100,000. The post Bitcoin ETFs Log First-Ever Back-to-Back $1B+ Inflows, What’s Next For BTC Price? appeared first on 99Bitcoins. -
Canada's job growth shines but Canadian dollar shrugs
um tópico no fórum postou Redator Radar do Mercado
The Canadian dollar is almost unchanged on Monday. In the European session, USD/CAD is trading at 1.3684, down 0.04% on the day. Canada's employment soars above expectations Canada's job growth for June was much stronger than expected. Employment jumped by 83.1 thousand, after an 8.8 gain in May and blew past the consensus of no change. The gain was mostly in part-time work, which climbed by 69.5 thousand. An additional positive surprise was the decline in the unemployment rate, which fell from 7% to 6.9%. This was below the consensus of 7.1%. The reading was significant as the unemployment rate had accelerated for three straight months. Wage growth eased to 3.2%, down from 3.5% in May. The drop eased concerns that rising wages would boost inflation. Opinions are the authors'; not necessarily that of OANDA Business Information & Services, Inc. or any of its affiliates, subsidiaries, officers or directors. The provided publication is for informational and educational purposes only. If you would like to reproduce or redistribute any of the content found on MarketPulse, an award winning forex, commodities and global indices analysis and news site service produced by OANDA Business Information & Services, Inc., please refer to the MarketPulse Terms of Use. Visit https://www.marketpulse.com/ to find out more about the beat of the global markets. © {CURRENT_YEAR} OANDA Business Information & Services Inc. -
Lockheed Martin reboots Pacific seabed mining plans
um tópico no fórum postou Redator Radar do Mercado
Lockheed Martin (NYSE: LMT) is back in the deep-sea mining game, holding talks with several mining companies about partnerships to access its long-held seabed licences in the Pacific Ocean. The US defence giant holds two licences in the Clarion-Clipperton Zone (CCZ), a mineral-rich area of international waters in the eastern Pacific. These were granted by US regulators in the early 1980s during the first wave of interest in ocean mining but remained unused for decades. Lockheed appeared to exit the sector in 2023, when it sold its UK-based deep-sea mining subsidiary, UK Seabed Resources, to Norway’s Loke Marine Minerals. That firm filed for bankruptcy in April, prompting an asset auction that returned the two licences to Lockheed’s control. Renewed opportunity Chief operating officer Frank St John told the Financial Times there was “large interest” from undersea mining groups in accessing the licences. He said Lockheed is evaluating options to secure supplies of critical raw materials and is working closely with the Pentagon to identify resources that could support stockpiling or alternative sourcing strategies. President Donald Trump issued an executive order in April asserting US rights to issue mining licences in international waters and proposing that seabed metals be treated as strategic assets. Lockheed says the US has a chance to set a global standard for commercial recovery of seabed nodules “in an environmentally responsible manner”. Polymetallic nodules — rock-like formations packed with nickel, cobalt, copper, manganese and other minerals critical for electric vehicles and electronics — are believed to be abundant in the Pacific. US government estimates suggest over one billion metric tonnes of these nodules lie within American-licensed zones, with the potential to add $300 billion to GDP and create 100,000 jobs over a decade. Interest from mining firms has surged. Companies based or listed in North America, including Canada’s The Metals Company (Nasdaq: TMC), have recently applied for seabed mining licences. Hurdles remain Seabed mining ambitions still face turbulent waters. The International Seabed Authority (ISA), created by the UN Convention on the Law of the Sea — a treaty the US has never ratified — continues to develop environmental and regulatory frameworks for deep-sea mining. Representatives from 169 countries and the EU have been negotiating standards on royalties, taxation, and environmental impact, including acceptable levels of underwater noise and sediment. The ISA is holding crucial talks in Jamaica this month to decide under what conditions mining operations may begin. In parallel, the US continues to operate its own licensing regime through the National Oceanic and Atmospheric Administration. -
Overview: The market has taken the US threat of 30% tariffs on the EU and Mexico in stride. Both currencies wobbled a little but are little changed as the North American session is about to start. Participants seem to recognize the threat as a tactic meant to increase the pressure to negotiate (i.e., make new concessions). Market participants also do not seem to give much credence to claims that cost overruns at a remodeling the Federal Reserve headquarters will give President Trump the justification he has been looking for to fire Chair Powell. The dollar is narrowly mixed against the G10 currencies. The Dollar Index has marginally extended its gains. It has not posted a closing loss since July 2. Emerging market currencies are also mixed. The offshore yuan is slightly firmer after posting a wider than expected trade surplus and stronger aggregate credit growth. Equities are mostly weaker today. In the Asia Pacific area, most of the large bourses were lower but China, Hong Kong, and South Korea. The MSCI Asia Pacific Index has fallen for the past two weeks. Europe's Stoxx 600 fell by 1% before the weekend, the largest decline in three months. It is off another 0.3% today. US index futures are nursing modest losses. The S&P 500 and Nasdaq made set record highs last Thursday before pulling back ahead of the weekend. The earnings season kicks off properly with several large banks on Wednesday. Benchmark 10-year yields played catch-up after the rise in the US and Europe before the weekend. Japanese long-dated bond sold off sharply. European yields are narrowly mixed, while the 10-year US Treasury yield is up around a basis point to 4.42%. Gold is firm near $3366 after reaching $3375 in Asia Pacific turnover. August WTI rose to about $66.60, its highest level since June 23. President Trump is expected to make an announcement about Russia today and some suspect it could include stepped up efforts to restrict Russia's oil sales. USD: The Dollar Index rose every session last week and its 0.65% gain, as modest as it is, was the largest weekly gain in two months. The five-day moving average is poised to move above the 20-day moving average for the first time since May 22. It has edged up to 98.10 today. A push above 98.25 is needed to be anything noteworthy from a technical point of view, and even then, a gap from last month extends 98.35. Tomorrow's CPI is arguably the most important data point of the week, which also sees industrial production, retail sales, and import prices. The low base effect and the 0.3% rise that the median of economists polled by Bloomberg expect will translate the highest year-over-year rates since February. Last week's minutes from the recent FOMC meeting suggest that the threshold to cut interest rates is still not at hand. At the end of June and early July, the Fed funds futures had a September cut fully discounted. Now it is less than 75% priced. Meanwhile, the White House and its allies think that the renovations at the Federal Reserve will give the president "cause" to fire Fed Chair Powell. Although some observers are taking it seriously, the market is not. EURO: The euro has been drifting lower since the $1.1830 was approached on July 1. It fell to about $1.1665 by the end of last week, where the 20-day moving average is found. While it has exceeded the (38.2%) retracement of the rally since June 23, it has stopped short of the (50%) objective near $1.1640. It slipped a little closer to it today (~$1.1650) and is extending its losing streak for the fourth consecutive session. A break could target $1.1600 initially. On Saturday, the US indicated that barring a successful conclusion to the trade talks, EU goods will be slapped with a 30% levy. The market understands this to be a negotiating tactic. The week's data highlights are tomorrow. The eurozone reports May industrial production and Germany sees the ZEW investor survey. After imploding by 2.4% in April, industrial production may have stabilized in aggregate but that masks a strong divergence: a recovery in Germany and Spain, but a continued contraction in France and Italy (and down more than expected). Sentiment among German investors is gradually improving, arguably encouraged by the coming infrastructure and defense spending. CNY: The PBOC has introduced a little more flexibility in the exchange rate and tolerated a modest appreciation of the yuan. The average daily change in the midpoint of the dollar's allowable range has become greater in recent months. The yuan is rising against the dollar but at a gradual pace. The 1.8% gain is a little more than implied by the 10-year interest rate differential or inflation differential. The PBOC is accommodating. It set the dollar's reference rate before the weekend at its lowest since last November (CNY7.1475) and today's was a little higher at CNY7.1491. A lower midrate means and lower dollar cap that is also a higher floor for the yuan. The dollar is consolidating in the recent range--CNH7.15-CNH7.19. Neither the larger trade surplus nor the stronger credit expansion pushed the dollar out of the pre-weekend trading range against the offshore yuan (~CNH7.1675-CNH7.1760). Helped by a recovery in exports to the US following the trade thaw, Chinese exports rose 5.8% year-over-year (4.8% May). Imports rose 1.1% (-3.4% May). The trade surplus was nearly $114.8 bln. Exports to the US are down 16% year-over-year and were off 34% year-over-year in May and 21% in April. Aggregate financing accelerated slightly to CNY22.83 trillion (year-to-date) to stand around 26% above a year ago, slightly greater than May. JPY: The dollar enjoys strong momentum against the yen and posted its highest settlement in nearly two months ahead of the weekend and a few ticks more today to reach almost JPY147.60. It is approaching the tentative trendline connecting the May and June highs (~JPY147.80). Above there is the June high itself slightly above JPY148.00. The fraying of the upper Bollinger Band (~JPY147.60) suggests proceeding with caution. To the extent the rates are an important driver of the exchange rate, the market appears to have priced in a firm US CPI report. It seems like when a buy-the-rumor, sell-the-fact drama often unfolds. After plummeting 9.1% in April, private sector core machinery orders (excluding shipbuilding and utilities), they fell another 0.6% in May, according to data reported earlier today. It is as if orders jumped in March (13%) and are returning to status quo ante. The industrial side of the economy seems to lack much forward momentum. The final May industrial production figures slipped by 0.1% rather than rise 0.5% as the preliminary report suggested. On the other hand, the tertiary activities index rose 0.6% in June after a 0.5% gain in May (initially 0.3%), suggesting services are The Tokyo CPI points to a softer national figure due at the end of the week. Meanwhile, Japanese long-dated bonds lurched lower. The 30-year JGB yield rose 10 bp and is approaching the May high near 3.20%. The 40-year JGB yield rose about eight basis points to ~3.43%. The May high was closer to 3.70%. GBP: The disappointing May GDP saw sterling punch through the $1.3530 lows that corresponded to the (61.8%) retracement of the sterling's rally from the June 23 low. Sterling has fallen for six consecutive sessions coming into today and the five-day moving average has crossed below the 20-day. moving average. Its losses were extended to almost $1.3450 today. It has not been able to resurface above $1.3500 since the low was recorded. The highlight of the week lies ahead. The June CPI is due Wednesday followed by the labor market report on Thursday. CAD: The stronger than expected June jobs data helped the Canadian dollar recoup the initial losses inflicted on the US 35% tariff threat. The Canadian dollar lost a net of about 0.20% on Friday, a middling performer within the G10. Still, the greenback appears to have forged a base in the CAD1.3640-60 area. It is recording an inside day and has been confined to a CAD1.33675-CAD1.3720 range so far today. The TSX fared better than most major bourses ahead of the weekend, slipping by about 0.30%. However, the 10-year yield rose to 3.50%, a six-month high. Canada report June CPI tomorrow, the data highlight of the week. The base effect warns of upside risks. In June 2024, prices fell by 0.1%. While the headline was below 2% in May (1.7%), the underlying core measures were elevated at 3%. Going into the report, the market is having second thoughts about a cut another cut this year. The odds of a September cut were further downgraded last week to 40% from around 80% in late June. The swaps market implies a year-end rate of a little more than 2.50%, the highest since February. AUD: The Australian dollar stalled after setting a marginal new high for the year (~$0.6595). After a flurry of activity in early Asia-Pacific trading on Friday, the Aussie chopped around in a fifth of a cent trading range (~$0.6560-$0.6580). It slipped to about $0.6555 today before steadying. Establishing a foothold above $0.6600 leaves little on the charts ahead of $0.6700. Despite being fooled last week by the RBA's decision to stand pat, the futures market pricing is 90%+ chance of a cut next month. Another cut in Q4 is fully discounted. MXN: The peso remains resilient. It reached its best level since last August in the middle of last week near MXN18.5525. It managed to absorb the shock of 50% tariff on Brazil and a 35% tariff on Canada without breaking. In fact, the dollar's high last week was set Monday a little above MXN. Over the weekend, the US indicated purchases of Mexico's goods, ostensibly not meeting the domestic content rules of the USMCA, will be subject to a 30% tariff on August 1 unless a new deal is struck. The peso has largely shrugged it off and the dollar remains within the pre-weekend range, trading between roughly MXN18.6550 and MXN18.7175 today. Disclaimer
-
Bitcoin Price Breaks 8-Year Resistance Line That Failed In 2017-2021
um tópico no fórum postou Redator Radar do Mercado
With the Bitcoin price rising to new all-time highs every other day, more crypto analysts have come forth with their predictions for where the pioneer cryptocurrency could be headed next. One analyst in particular points out an incredibly bullish development on the Bitcoin price chart that suggests that the rally is far from over. As the trend continues to play out, it is possible that the rise above $118,000 is only the start of the uptrend. Bitcoin Enters Full Price Discovery After clearing the resistance at $117,000, the Bitcoin price has now entered what crypto analysts are referring to as price discovery. This term refers to buyers and sellers determining the price of Bitcoin, and there seems to be a consensus that the digital asset is worth more, and this could trigger the next uptrend. An analysis from crypto analyst AltcoinGordon focuses on a particular resistance line that has persisted for the Bitcoin price for the last eight years. This resistance line went through the highs from both March and November 2021, and was not broken. Then again, through the nights in May 2025, and remained unbroken. However, the resistance line has finally succumbed to pressure from the bulls and has been broken through after Bitcoin made it through $117,000. This simply means that there is nothing now holding back the digital asset, allowing it to climb freely from here. Due to this, the analyst believes that this breakout is no ordinary breakout, but rather one that triggers the start of parabolas. In this case, a parabolic rally would lead the Bitcoin price above the $130,000 level if the momentum is maintained. BTC Price Discovery Is Good For Altcoins Altcoin Gordon points out that the Bitcoin price discovery is particularly good for altcoins, as they will rally harder. “Price discovery is in full effect now. And when that happens… alts go wild,” the post read. This has already started playing out as altcoins have been outperforming the Bitcoin price recently. According to the Altcoin Season Index by CoinMarketCap, 27 of the top 50 altcoins have outperformed the Bitcoin price over the last 90 days. This brings the index closer to the 50 top altcoins that are required to outperform Bitcoin over a 90-day period to kickstart the altcoin season. When this happens, the altcoin season will be in full bloom. Once the index crosses the 50 mark, then the parabola for alts is expected to fully begin. For example, back in 2021, the Altcoin Season Index reached a score of 98 before marking the top, and this high figure has been consistence throughout the last three bull markets. Therefore, it is natural to expect that this altcoin season will follow the same trend. -
Markets Today: Bitcoins Surge to $123k. China Exports Rise, DAX Retests 24000 Support
um tópico no fórum postou Redator Radar do Mercado
Asian Market Wrap U.S. and European stock futures dropped at the start of the week after President Trump announced a 30% tariff on goods from the EU and Mexico. S&P 500 futures fell 0.4%, and European stock futures dipped 0.6%. Meanwhile, Asian stocks stayed mostly flat, with small gains in Hong Kong and China. close Source: TradingView.com (click to enlarge) Source: TradingView.com (click to enlarge) Support 117500112000109000 (Bear flag retest)Resistance 123236125000130000Follow Zain on Twitter/X for Additional Market News and Insights @zvawda Opinions are the authors'; not necessarily that of OANDA Business Information & Services, Inc. or any of its affiliates, subsidiaries, officers or directors. The provided publication is for informational and educational purposes only. If you would like to reproduce or redistribute any of the content found on MarketPulse, an award winning forex, commodities and global indices analysis and news site service produced by OANDA Business Information & Services, Inc., please refer to the MarketPulse Terms of Use. Visit https://www.marketpulse.com/ to find out more about the beat of the global markets. © {CURRENT_YEAR} OANDA Business Information & Services Inc. -
BHP to explore battery partnerships with CATL, BYD
um tópico no fórum postou Redator Radar do Mercado
BHP (NYSE: BHP) has signed preliminary agreements with China’s leading battery makers, Contemporary Amperex Technology Co. (CATL) and BYD’s FinDreams Battery Co. (FDB), to evaluate the use of battery-powered solutions across its global mining operations. The partnerships will focus on developing powertrain battery systems for heavy-duty mining equipment and locomotives, fast-charging infrastructure, energy storage and battery recycling to cut diesel reliance and curb greenhouse gas emissions. BHP and CATL will jointly research and develop battery modules for haul trucks and locomotives, particularly in Western Australia’s iron-ore corridors, while the FDB partnership will explore BYD’s commercial and light vehicles for site-level mobility and flash-charging stations to displace diesel use. Shares of BHP fell 0.9% in Australia on Monday. The company has a market capitalization of $132.14 billion. Emissions targets The initiatives form part of BHP’s medium-term goal to cut operational emissions by at least 30% by 2030 from 2020 levels, and its long-range ambition to reach net-zero Scopes 1 and 2 emissions by calendar year 2050. “This relationship is a further step towards BHP meeting our decarbonisation ambitions… by joining forces with industry leaders [like BYD], we are seeking solutions to help shape a more productive and more sustainable resources industry of the future,” said Rashpal Bhatti, BHP Group Procurement Officer. Jack Li, GM of FDB’s Global Commercial Vehicle Business Unit, added: “This MOU… represents a pivotal milestone… for accelerating decarbonisation across the global resources sector”. -
Stellar (XLM) Set To Explode? 92% Rally Sparks Bullish Frenzy—Details
um tópico no fórum postou Redator Radar do Mercado
Stellar (XLM) has seen a sudden burst of activity this week. According to recent data, XLM jumped 12% in the last 24 hours to trade around $0.48. Its seven‑day return is even more eye‑catching, with a gain of 92%. Trading volume on spot markets climbed to $14 billion, a 17% rise, showing that investors are piling in. Support Turns Into Base Based on reports, the old resistance zone at $0.31 up to $0.37 has flipped into a solid support area. That shift gives buyers a clear line in the sand. Wave 3 in the Elliott count seems to be stretching higher, suggesting there’s room for more upside if momentum holds. Derivatives Activity Paints A Mixed Picture Spot volume is surging. But derivatives tell a slightly different story. CoinGlass figures show that derivatives trading volume slipped 2.25% to $3.80 billion even as Open Interest jumped 29% to $496 million. The rise in Open Interest means more new positions are on the table. Yet funding rates indicate traders aren’t over‑leveraging just to chase quick gains. The Relative Strength Index (RSI) is sitting near 89, well above the usual overbought threshold of 70. That level often triggers short‑term pullbacks. Still, in a strong uptrend, RSI can hug lofty readings for longer than many expect. The MACD line at 0.02 lies comfortably above its signal line at 0.01, and the growing histogram bars hint that bullish momentum is not fading anytime soon. Nine-Year Trend Shows Strength Analysts point out that Stellar has logged nine straight years of higher lows. That pattern has held through bear markets and bull runs alike. If that trend stays intact, it could pave the way for a fifth wave—or a Wave C—move similar to past rallies in major altcoins. Market Activity Signals Caution Traders are keeping a close eye on volume and on‑chain signals. Sharp inflections in RSI or a sudden shift in funding rates could spark profit‑taking. A pullback toward the $0.35–$0.38 zone would still leave XLM in a bullish setup, and it might give fresh buyers a better entry point. Based on the mix of strong on‑chain support, robust momentum indicators, and a long‑term uptrend, Stellar looks set for more gains. But with 92% surge in a week, a pause or small correction wouldn’t be a surprise. Traders and investors will be watching closely as sessions unfold to see if XLM can push past $0.50 or if it takes that breather first. Featured image from Meta, chart from TradingView -
 🚨 CZ (Binance) Prevê Novo Ciclo de Alta Exponencial do Bitcoin: "O Atual Topo Será Apenas um Ponto no Gráfico Futuro" Por Igor Pereira – Analista de Mercado Financeiro e Membro Junior WallStreet NYSE ExpertFX School – Julho de 2025 O fundador e CEO da Binance, Changpeng Zhao (CZ), voltou a gerar repercussão no mercado cripto ao afirmar que, apesar do atual recorde histórico do Bitcoin acima de US$ 121 mil, o preço atual será visto no futuro como apenas uma “pequena parte” do verdadeiro potencial de valorização do ativo. A declaração ocorre em meio a um ambiente macroeconômico de rápida transformação: o dólar dos EUA em queda, juros em alta, déficits fiscais disparando e uma institucionalização crescente dos criptoativos. 🌍 Contexto Macro: Crise Fiscal e Perda de Confiança no Dólar A fala de CZ reforça uma visão que vem sendo cada vez mais adotada por gestores e fundos institucionais: o Bitcoin não é mais apenas uma aposta especulativa — é um ativo de proteção contra a desvalorização monetária, especialmente num cenário onde: O índice do dólar (DXY) já acumula queda de -11% em 2025; O pacote fiscal de Trump ("Big Beautiful Bill") eleva os déficits a níveis históricos; O ETF de Bitcoin ($IBIT) já atinge US$ 76 bilhões em ativos sob gestão, superando marcos que levaram décadas para serem atingidos por ETFs tradicionais de commodities. Esse movimento representa uma migração silenciosa de capital institucional para ativos escassos e resistentes à censura, como o BTC. 📊 Perspectiva Técnica e de Longo Prazo Embora o **BTC/USD tenha rompido recordes recentes e esteja cotado a US$ 121.199,70, a fala de CZ antecipa um cenário onde novos patamares como US$ 200 mil, US$ 250 mil ou até US$ 500 mil possam se tornar realidade no médio/longo prazo, conforme os fundamentos se alinham: Emissão limitada a 21 milhões de moedas; Crescimento da demanda institucional (fundos, bancos, family offices); Risco de ruptura na política monetária tradicional (Fed pressionado por Trump); Crescente desdolarização global liderada por países como China, Rússia e Irã. 🪙 Oportunidade ou Euforia? Embora o discurso de CZ possa parecer otimista demais para alguns analistas tradicionais, o contexto atual justifica uma reprecificação estrutural do Bitcoin, especialmente se considerado como: Reserva digital de valor (Digital Gold); Hedge contra inflação e contra política monetária intervencionista; Alternativa legítima ao sistema financeiro tradicional. ⚖️ Impactos no Mercado Bitcoin (BTC/USD): Fortalece a expectativa de alta estrutural, com projeções de continuidade da tendência em direção aos US$ 130.000–140.000 no curto/médio prazo. Altcoins: Tendência de seletividade. Com o ciclo sendo liderado por Bitcoin, altcoins devem sofrer bifurcação — apenas projetos sólidos devem acompanhar o rally. XAU/USD (Ouro): Apesar da concorrência com o Bitcoin, o ouro segue como porto seguro institucional, especialmente diante de riscos geopolíticos crescentes. DXY (Índice do Dólar): A tendência de enfraquecimento do dólar pode intensificar a migração de reservas para ativos reais — BTC incluso. 🔍 Conclusão do Analista A declaração de CZ não deve ser interpretada apenas como otimismo de um entusiasta do setor. Trata-se de uma visão alinhada com dados macroeconômicos, fluxo institucional e desconfiança crescente no sistema fiduciário tradicional. Créditos: Igor Pereira – Analista de Mercado Financeiro e Membro Junior WallStreet NYSE ExpertFX School – Julho de 2025
 -
Major US stock indices extended their losses from last Friday into today’s Asian session. Both S&P 500 and Nasdaq 100 E-mini futures dropped by 0.5% at the time of writing, weighed down by renewed tariff anxieties. US President Trump issued a surprise escalation, threatening the European Union with a 30% tariff—an increase from April’s proposed 20%, if no improved trade terms are reached before the 1 August deadline. This move follows a series of aggressive tariff demand letters sent to US trading partners over the past week. Hopes for a preliminary US-EU trade deal were dashed after recent media reports hinted at progress, only for negotiations to hit fresh roadblocks. Germany’s DAX reflected this disappointment with a second straight loss of 0.8% last Friday. close Fig 2: Gold (XAU/USD) minor trend as of 14 July 2025 (Source: TradingView) Fig 2: Gold (XAU/USD) minor trend as of 14 July 2025 (Source: TradingView) Recent price actions of Gold (XAU/USD) have managed to retest and stage a rebound from its medium-term ascending trendline in place since the 31 December 2024 low. It has formed a minor “Double Bottom” bullish reversal configuration, taking into account the two swing lows of 30 June and 9 July. Right now, Gold (XAU/USD) is breaking above the US$3,360 intermediate neckline resistance of the minor “Double Bottom” configuration (see Fig 2) In addition, the hourly RSI momentum indicator has continued to flash a bullish momentum condition. Watch the US$3,328 key short-term pivotal support (also the 50-day moving average) for the next intermediate resistances to come in at US$3,400 and US$3,450 in the first step. On the other hand, a break below US$3,328 negates the bullish tone for another choppy minor corrective decline sequence to expose the next intermediate support at US$3,293/3,282. Opinions are the authors'; not necessarily that of OANDA Business Information & Services, Inc. or any of its affiliates, subsidiaries, officers or directors. The provided publication is for informational and educational purposes only. If you would like to reproduce or redistribute any of the content found on MarketPulse, an award winning forex, commodities and global indices analysis and news site service produced by OANDA Business Information & Services, Inc., please refer to the MarketPulse Terms of Use. Visit https://www.marketpulse.com/ to find out more about the beat of the global markets. © {CURRENT_YEAR} OANDA Business Information & Services Inc.
-
The Bitcoin Liquidity Supercycle Has Just Begun, Says Hedge Fund CEO
um tópico no fórum postou Redator Radar do Mercado
Bitcoin punched through a fresh record above $122,000 on the morning of 14 July, extending its month-long rally to more than 16 percent. Against that backdrop, Charles Edwards—the founder and chief executive of digital-asset hedge fund Capriole Investments—argues that the market is only “in the early stages” of a much broader liquidity-driven boom that could dominate the rest of 2025 and beyond. The Bitcoin Liquidity Supercycle In the latest Capriole newsletter, Edwards contends that “money and liquidity provided the backdrop for capital flows, and Bitcoin Treasury Companies are the funnel.” He dismisses the idea that the past fortnight’s $20,000 advance was a technical accident, pointing instead to deep macro currents that have been building for months. “The biggest Bitcoin rallies occur when the market is net short the USD,” he writes, pointing to Capriole’s proprietary “USD Positioning” gauge, which aggregates futures data across major currencies. The metric has been “deeply negative” since early summer, signalling that global investors are decisively betting against the dollar and in favour of hard assets. Another pillar is credit. BBB-rated corporate-bond spreads have been grinding tighter since the spring, a classic risk-on signal in traditional markets that, since 2020, has mapped almost tick-for-tick onto major Bitcoin up-moves. “More evidence,” Edwards notes, “that Bitcoin is a tradfi asset.” Perhaps the strongest tail-wind, however, is raw money growth. Global M3 has been expanding at an annualised nine percent clip—an historically extreme rate that Capriole says last coincided with average 12-month Bitcoin returns of roughly 460 percent. Edwards cautions that, as a multi-trillion-dollar asset today, Bitcoin is unlikely to repeat that magnitude, “but it wouldn’t be surprising to see something very substantial from here.” Capriole’s framework also draws on an historical lead-lag relationship between gold and Bitcoin. When bullion enters a meaningful breakout, Bitcoin has tended to follow three to four months later. Gold’s early-2025 surge—and its outperformance versus global equities—therefore offered “strong support for the current market’s diminishing demand for fiat money and favour of hard money,” Edwards argues. Since Capriole flagged gold’s move in April, Bitcoin has risen 28 percent. Equities, too, are offering green lights. The New York Stock Exchange advance–decline line broke to new highs last week, while Capriole’s “Equity Premium” indicator reset to zero in late May—both historically consistent with multi-month stretches of expanding risk appetite. All of those data points feed into the firm’s flagship Bitcoin Macro Index, a composite of dozens of public and proprietary variables that Capriole uses to shape trading exposures in its fund. The index “is still in strong positive growth territory,” Edwards reports, even after the coin’s latest vertical move. That suggests the underlying drivers—liquidity, risk sentiment and on-chain activity—“remain intact.” The Bitcoin Treasury-Company Flywheel Yet perhaps the most striking piece of the puzzle lies outside pure macro. Edwards highlights the emergence of Bitcoin Treasury Companies (TCs)—corporate vehicles that raise fiat capital in equity or debt markets and then deploy it into spot BTC—as the new “primary bubble dynamic of this cycle.” Quarterly inflows into TCs reached $15 billion in Q2, and Capriole counts at least 145 such firms now pursuing the strategy. With their market capitalisations inflated by paper gains on balance-sheet coins, they can tap ever-larger funding rounds—a reflexive loop that Edwards believes “will likely help add over $1 trillion to Bitcoin’s market cap over the next year.” He rejects the notion that this amounts to unhealthy centralisation: “If Bitcoin is to one day become base money, it needs to scale to tens of trillions to flatten volatility. The only way that happens is mass acquisition like we are seeing today.” Edwards stresses that his analysis sits on a months-long horizon. “When Bitcoin sees huge rallies there are always strong pullbacks and local overheating,” he concedes, adding that the newsletter deliberately sidelines short-term on-chain froth to focus on the “bigger picture and driving factors for the next six months.” Still, with central-bank liquidity abundant, the dollar crowded short, credit stress muted and a structurally new pool of corporate buyers stepping in, Capriole’s conclusion is unambiguous: the liquidity tap is wide open, and the Bitcoin supercycle it feeds has only just begun. “While today’s early adopters may be seen as speculators, it will be very obvious in hindsight. After the Treasury company wave is the Government treasury wave (next cycle). We are simply riding the adoption curve which requires trillions of dollars to flow in to Bitcoin from the entities that have it in order to achieve scale,” Edwards concludes. At press time, BTC traded at $122,438. -
Bitcoin Price Hits $120K Milestone — Bulls Make History Again
um tópico no fórum postou Redator Radar do Mercado
Bitcoin price started a fresh increase above the $116,500 zone. BTC is now up over 2%, traded to a new high, and might extend gains above the $122,000 level. Bitcoin started a fresh increase above the $118,500 zone. The price is trading above $118,500 and the 100 hourly Simple moving average. There is a bullish trend line forming with support at $119,000 on the hourly chart of the BTC/USD pair (data feed from Kraken). The pair could continue to rise if it clears the $122,000 resistance zone. Bitcoin Price Sets New ATH Bitcoin price started a fresh increase after it cleared the $115,500 resistance zone. BTC gained pace for a move above the $116,000 and $118,500 resistance. The bulls even pumped the pair above the $120,000 resistance zone. A new all-time high was formed at $122,550 and the price is now consolidating gains above the 23.6% Fib retracement level of the upward move from the $116,679 swing low to the $122,550 high. Bitcoin is now trading above $120,000 and the 100 hourly Simple moving average. There is also a bullish trend line forming with support at $119,000 on the hourly chart of the BTC/USD pair. Immediate resistance on the upside is near the $122,550 level. The first key resistance is near the $1123,500 level. The next resistance could be $124,000. A close above the $124,000 resistance might send the price further higher. In the stated case, the price could rise and test the $128,000 resistance level. Any more gains might send the price toward the $128,800 level. The main target could be $130,000. Downside Correction In BTC? If Bitcoin fails to rise above the $122,500 resistance zone, it could start a downside correction. Immediate support is near the $121,500 level. The first major support is near the $119,500 level or the 50% Fib retracement level of the upward move from the $116,679 swing low to the $122,550 high. The next support is now near the $119,000 zone. Any more losses might send the price toward the $118,500 support in the near term. The main support sits at $116,500, below which BTC might continue to move down. Technical indicators: Hourly MACD – The MACD is now gaining pace in the bullish zone. Hourly RSI (Relative Strength Index) – The RSI for BTC/USD is now above the 50 level. Major Support Levels – $122,500, followed by $125,000. Major Resistance Levels – $121,500 and $119,000. -
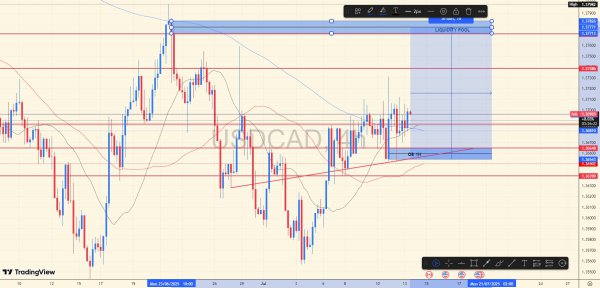 Perspectiva de análise RETEST OB 1H sobre rejeição 1x1H spring vermelho, retorno com AR acima de 1.36765 e continuação para o POOL de LIQUIDEZ. Stoploss não deve ser maior que o último spring 4H vermelho abaixo da OB 1H.
 -
Bitcoin Price Crash Possible As Correction Sentiment Takes Hold — $110,000 Next?
um tópico no fórum postou Redator Radar do Mercado
After hitting a new all-time high of $121,400, the Bitcoin price has started consolidating once again, although the support continues to hold. This is not out of the ordinary, as pullbacks after a major rally are quite common and could be the cool-off needed the uptrend to continue. However, while the $117,000 support has held nicely, it is possible that a deeper correction could be in the cards for the cryptocurrency before the price takes off again. Why A Bitcoin Price Crash Could Begin With the hit to new all-time highs, the weekend brought a slowdown, and this could drive the next wave of correction. Crypto analyst TehThomas explains this in a TradingView post that suggests that there is still the possibility of a short-term correction for the Bitcoin price. However, it could go deeper than expected as the price moves to retest newly formed support at $109,000 and $110,000. According to the analyst, the new peaks have plunged the Bitcoin price into uncharted territory, and there would be a new wave of sells from here. Given this, the analyst advices caution as investors engage with the market and the possibility of a deeper correction arises. Furthermore, there is the formation of an ascending trendline that formed with the horizontal support. Since the trendline moves through the $111,000-$113,000 area, it suggests that the price could fall back downward to retest this level. In the case of a deeper correction, then the analyst sees a price sweep into the $110,000 levels to take out liquidity. However, this sweep would be inherently bullish since the retest would provide a bounce-off point that could lead to a “more sustainable” breakout toward all-time highs. Bullish Prospects Still At Large For BTC While the possibility of a sweep down to former peak levels remains high, it is also possible that the price does not break down and instead continues its upward trajectory. Looking back at the ascending trendline, the analyst points out that it is possible that the price does hold the trendline, reducing the impact of the correction. Such a shallow correction would indicate a continuation without a deeper correction. In this case, the Bitcoin price could resume the uptrend with the $120,000-$125,000 targets in mind. Thus, any deep correction would be expected to begin at much higher price levels. “Bitcoin is currently in price discovery, which means the structure must guide our expectations. A retest of either the trendline or former resistance could provide the next best entry,” TehThomas explained. Regardless of what the case may be, the analyst believes that as long as the price remains above the $110,000 support, then it is inherently bullish. -
🚨 Bitcoin Entra em “Modo Crise”: Nova Alta Histórica Expõe Derretimento do Dólar e Corrida por Ativos Reais Por Igor Pereira – Analista de Mercado Financeiro e Membro Junior WallStreet NYSE ExpertFX School – Julho de 2025 O Bitcoin rompeu todas as métricas tradicionais de comportamento de mercado. Nas últimas sessões, a criptomoeda segue uma trajetória literalmente em linha reta rumo a novos recordes, superando várias máximas históricas no mesmo dia. Em apenas três meses, o mercado cripto adicionou mais de US$ 1 trilhão em valor, enquanto o índice do dólar (DXY) desabou -11% no mesmo período. A principal catalisadora dessa explosão de preço foi a aprovação, em 3 de julho, do chamado “Big Beautiful Bill” pelo Congresso dos EUA — um mega pacote de gastos fiscais proposto pelo presidente Donald Trump, visto como altamente inflacionário e expansivo do ponto de vista monetário. 📈 Alta Exponencial: Bitcoin em Crise... ou em Refúgio? Desde o anúncio do pacote fiscal, o BTC/USD valorizou mais de US$ 15.000, impulsionado por uma tempestade perfeita de fatores macroeconômicos: Alta dos juros nos Treasuries (yields subindo); Dólar em queda livre; Aumento dos preços do ouro (XAU/USD); Recordes de aportes institucionais via ETFs de Bitcoin, como o $IBIT, que atingiu US$ 76 bilhões em ativos sob gestão em menos de 350 dias — o mesmo que o ETF de ouro $GLD levou 15 anos para alcançar. 💸 Divergência Técnica: Bitcoin vs. Dólar Analisando o desempenho YTD (ano a ano), duas datas foram decisivas: 9 de abril: fim da pausa tarifária de 90 dias, com os rendimentos dos Treasuries começando a subir; 1º de julho: aprovação do Big Beautiful Bill. Desde então, Bitcoin, ouro e ações de commodities explodiram, enquanto o dólar mergulhou. A divergência entre DXY e BTC é tão forte que o S&P 500, em termos de Bitcoin, acumula -15% no ano. Desde 2012, o índice perdeu -99,98% de valor frente ao BTC. 🏛️ Investidores Institucionais Não Podem Mais Ignorar o Bitcoin Segundo sondagens de mercado e relatos de fundos, hedge funds, family offices e gestoras tradicionais estão começando a alocar até 1% do AUM (ativos sob gestão) em Bitcoin. Mesmo fundos mais conservadores estão reavaliando o BTC como proteção estrutural diante de: Expansão fiscal descontrolada nos EUA; Política monetária desancorada e manipulada politicamente; Busca por ativos líquidos, escassos e globais. 📌 Bitcoin e Ouro: Dupla de Refúgio em Meio à Crise do Dólar Tanto Bitcoin quanto ouro estão subindo juntos, algo raramente observado em ciclos anteriores. Historicamente, o BTC liderava em períodos de excesso de liquidez, enquanto o ouro reagia a crises geopolíticas. Agora, ambos convergem para o mesmo papel: refúgio contra a deterioração estrutural do dólar. Ativo YTD (2025) Posição atual BTC/USD +153% US$ 121.199,70 XAU/USD +24% US$ 3.360 DXY (USD) -11% 97,60 pts ETF IBIT +140% AUM US$ 76 bilhões 🎯 Conclusão do Analista O Bitcoin entrou oficialmente em "modo crise", não no sentido de colapso, mas como sintoma de que algo estrutural está profundamente errado no sistema monetário global. O mercado está fazendo um ajuste silencioso: hedge contra déficit, contra inflação futura e contra manipulação monetária. Créditos: Igor Pereira – Analista de Mercado Financeiro e Membro Junior WallStreet NYSE ExpertFX School – Julho de 2025
- Yesterday
-
🚨Trump Pressiona por Demissão de Powell: A Nova Frente de Conflito com o Federal Reserve Por Igor Pereira – Analista de Mercado Financeiro e Membro Junior WallStreet NYSE ExpertFX School – 14 de julho de 2025 A relação entre a Casa Branca e o Federal Reserve volta ao centro do cenário político e financeiro global. Segundo declarações do conselheiro econômico Kevin Hassett, o presidente Donald Trump considera demitir o atual presidente do Fed, Jerome Powell, alegando "justa causa" relacionada a excessos nos custos de renovação da sede do banco central em Washington, um projeto estimado em US$ 2,5 bilhões. As declarações abrem um precedente histórico e institucional sem paralelos recentes, reacendendo temores sobre a independência do Fed e ampliando os riscos políticos que afetam diretamente as taxas de juros, o dólar e o mercado de ouro (XAU/USD). 🏛️ O Caso: Custos Exorbitantes e a “Renovação Palaciana” do Fed O pivô da crise institucional envolve uma investigação sobre os custos de renovação da sede do Fed, que subiram de US$ 1,9 bilhão para US$ 2,4 bilhões, segundo relatório do Inspetor-Geral. O projeto foi criticado por membros do governo como “extravagante”, com menções a “jardins no terraço, mármore premium, salas VIP e elevadores especiais” — acusações que o próprio Powell rebateu em audiência no Senado: Apesar disso, Kevin Hassett afirmou em rede nacional que a administração “estuda ativamente” a possibilidade de demissão de Powell com base nesse escândalo orçamentário. Paralelamente, o ex-governador Kevin Warsh — possível substituto de Powell — defendeu no domingo uma “mudança de regime no Fed”, afirmando que o banco central perdeu o rumo tanto na política monetária quanto na supervisão financeira. ⚖️ Trump Pode Demitir Powell? A autoridade para demitir o presidente do Fed é legalmente controversa. Segundo o republicano French Hill, que preside o Comitê de Serviços Financeiros da Câmara, Trump não possui essa autoridade de forma unilateral, embora tenha o poder de indicar sucessores e criticar publicamente a gestão atual: No entanto, Hassett reforçou que “caso se comprove justa causa, a demissão é juridicamente possível”, abrindo caminho para uma potencial batalha constitucional entre os Poderes Executivo e Monetário. 💥 Impacto no Mercado Financeiro 📌 1. Dólar e Treasuries A possibilidade de interferência política direta no Fed pode gerar desconfiança dos investidores institucionais e estrangeiros, pressionando o dólar e provocando volatilidade nos Treasuries de 10 e 30 anos. Caso Powell seja demitido, o mercado poderá precificar uma mudança mais agressiva na trajetória de juros, com risco de afrouxamento monetário sob influência política. 📌 2. XAU/USD (Ouro) O ouro pode ganhar forte tração como ativo de proteção institucional, especialmente diante do aumento da percepção de risco nos EUA. O XAU/USD já superou a média móvel de 50 dias e mira a região dos US$ 3.400 a US$ 3.500, com suporte imediato em US$ 3.310. Um evento como a demissão de Powell pode disparar uma corrida por ouro físico e contratos na Comex. 📌 3. Risco Sistêmico e Confiança A substituição de Powell por um nome alinhado politicamente, como Kevin Warsh, pode desencadear críticas globais sobre a perda de independência do Fed, prejudicando a credibilidade da política monetária americana. Agências de rating e bancos centrais estrangeiros podem reavaliar sua exposição ao dólar e aos ativos norte-americanos, com possível repercussão negativa no fluxo cambial e nos ativos de risco. 📊 O Que Esperar nos Próximos Dias? Fator Expectativa Moeda USD Volatilidade e possível desvalorização no curto prazo XAU/USD Potencial explosivo de alta em caso de ruptura institucional S&P 500 Correção técnica possível diante de incerteza política Volatilidade (VIX) Alta provável se Trump formalizar tentativa de demissão 🎯 Conclusão do Analista A crise entre o governo Trump e o Federal Reserve representa um ponto de inflexão no equilíbrio entre os Poderes nos EUA. A possível demissão de Powell, caso avance, pode abalar as fundações da independência do banco central americano — um dos pilares da confiança global na moeda e nos títulos do Tesouro dos EUA. Créditos: Igor Pereira – Analista de Mercado Financeiro e Membro Junior WallStreet NYSE ExpertFX School – Julho de 2025