

XAU/USD price analysis and forecast: Optimism around a US-Iran peace agreement supports gold

BY
Ben Graham
|

By using this site, you agree to our Terms of Use of Use and Privacy Policy
Gold (XAU/USD) is pulling back slightly from its intraday high but remains broadly supported and is trading near the psychological $4,300 level. The precious metal has benefited from profit-taking in the U.S. dollar after its strong rally to the highest levels seen since late March. The catalyst was the conclusion of a peace agreement between the United States and Iran.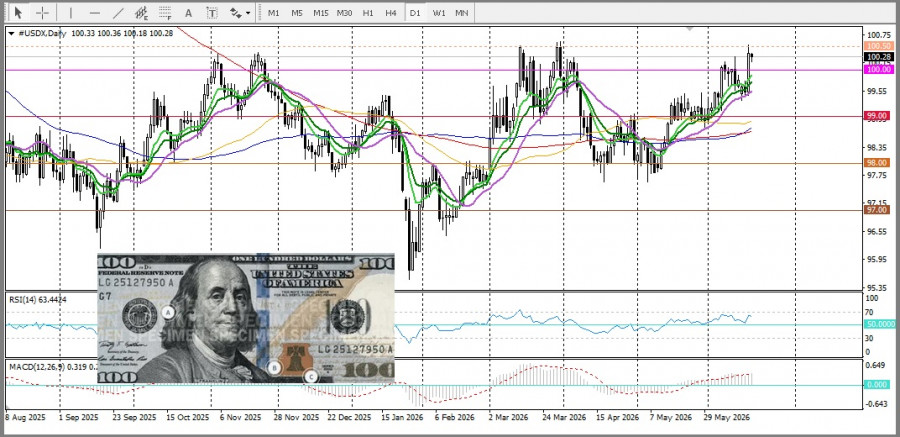 Specifically, U.S. President Donald Trump and Iranian President Masoud Pezeshkian signed a memorandum of understanding remotely, providing for a cessation of military actions and the restoration of shipping through the Strait of Hormuz. Additional optimism was generated by Trump's statement that the 60-day negotiation period regarding Iran's nuclear program should not be viewed as a final deadline, which strengthened investor confidence.
These expectations triggered a sharp rise in U.S. Treasury yields, supporting the dollar and limiting demand for gold. As a result, market participants remain cautious and are reluctant to increase long positions in the precious metal without confirmation of further upward momentum.
Against this backdrop, it would be prudent to wait for sustained buying interest before expecting a continuation of gold's recovery from the $4,215 level, where last week's low was formed.
Traders are now focused on upcoming U.S. macroeconomic releases, including the Philadelphia Fed Manufacturing Index and weekly Initial Jobless Claims data, which will be released during the North American session. Comments from FOMC officials may also contribute to increased market volatility.
From a technical perspective, the failed attempt to consolidate above the $4,350-$4,360 level has increased buyer caution. At the same time, the subsequent decline stalled near the $4,260 level, which is currently acting as a key short-term support level.
The RSI is hovering near 44, signaling weakening momentum, while the MACD remains moderately positive, suggesting a reduction in selling pressure rather than the formation of a sustainable upward trend. Nevertheless, both indicators remain below their neutral levels, indicating that bears continue to hold the advantage.
Therefore, confirmation of further gains would require a decisive consolidation above the $4,350-$4,360 level. In that case, the next upside targets could be the 50% Fibonacci retracement level near $4,460 and the 200-day Simple Moving Average (SMA).
On the other hand, the next support level is located near $4,200.