

Gold, Silver, Bitcoin or Ethereum: What's the biggest loser in 2026?

BY
Marina Castellani
|

By using this site, you agree to our Terms of Use of Use and Privacy Policy
In a year marked by geopolitical turmoil, traders who looked for shelter in gold, silver, Bitcoin or Ethereum have faced a difficult reality. All four have suffered substantial declines from their highs.
So which has been the biggest loser—gold, silver, Bitcoin or Ethereum?
The answer depends on how you measure the damage. The largest decline from a peak does not necessarily mean the worst performance since the end of 2025.
For traders, however, this comparison offers more than a ranking. It puts the selloffs into perspective at a time when every pause can tempt buyers to call a bottom.
Why Comparing the Declines Matters
After a large decline, an asset can look cheap simply because it once traded much higher.
But a discount to the high does not establish value, and a pause in selling does not confirm a turn. A market can rebound sharply, attract fresh buyers and then resume its decline.
This is where longer-term charts become useful. Before deciding that a market has fallen far enough, step back and examine the broader price structure.
Is the rebound changing the trend, or is it another correction within it?
Monthly charts help frame that question. Comparing the same timeframe across all four assets also makes it easier to distinguish relative resilience from outright weakness.
Two Ways to Measure the Biggest Loser
There are two separate comparisons:
An asset that surged early in the year and then collapsed could have the largest peak-to-trough decline while still outperforming another asset on a year-to-date basis.
All-time highs add another reference point, but they should be identified separately when they occurred before 2026. Otherwise, the comparison mixes different periods.
For a fair ranking, use the same endpoint for all four assets. Comparing their respective lows measures the worst drawdown each experienced; comparing prices at one common timestamp measures their relative performance at that moment.
Those are useful comparisons, but they answer different questions.
Can Monthly Charts Be Used for Trading?
It would make life easy to put on a trade, walk away and return months later to collect the profits.
Living through the price swings is another matter.
Monthly charts can encompass substantial countertrend moves. A position that looks straightforward in hindsight may have required considerable patience, sufficient capital and carefully controlled exposure to survive along the way.
Using little or no leverage can reduce financing and margin pressure, but it does not remove the risk of a large loss.
For my purposes, monthly charts are a starting point. They help identify the major trend and the side of the market to focus on. I then drill down through shorter timeframes to assess the developing structure, nearby levels and immediate momentum.
The monthly chart provides perspective. The shorter charts help turn that perspective into a trading decision.
Where the Four-Week Trading System Fits
A commodities trader introduced me to a four-week trading system many years ago.
The basic approach is straightforward:
Twenty completed trading sessions are commonly used as an approximation of four weeks in markets that trade five days a week. The current session is excluded from the lookback. For cryptocurrencies, which trade seven days a week, four calendar weeks cover 28 daily sessions.
This is a rolling breakout system rather than a system based on monthly candles.
Its logic is that a new four-week high or low signals movement beyond the recent trading range. It seeks sustained trends, but sideways conditions can produce repeated false breaks.
It is not a system I would choose to trade mechanically. Nevertheless, I keep the concept in mind when a currency or any asset approaches a significant breakout. It provides another way to ask whether one side is gaining control.
Related: The Difference Between Trading and Gambling: What Every Trader Should Know
Gold: A Safe-Haven Reputation Meets a Deep Drawdown
Gold’s reputation makes its decline particularly striking.
XAUUSD set its low at $3832 on November 16. That is a 31.5% fall from its $5595 record high in January.
That illustrates an important distinction: an asset can have a long-standing safe-haven role and still suffer a substantial decline over a particular period.
The monthly chart helps show whether recent buying is repairing the broader structure or merely interrupting the selling.
XAUUSD monthly chart
Silver: A Bigger Boom and a Bigger Retreat?
Silver’s early-year surge and subsequent retreat make it a key contender in the drawdown comparison.
The question is how much of that advance has been surrendered and whether the monthly chart shows any convincing change in direction.
A dramatic decline can encourage bargain hunting. But the distance from the high does not tell traders whether sellers have finished.
XAGUSD monthly chart
Bitcoin: Separate This Year’s High From the All-Time Peak
Bitcoin requires a clear distinction between its 2026 high and its all-time high from 2025.
Measuring from the earlier record describes the broader retreat. Measuring from the 2026 high allows a more consistent comparison with this year’s peaks in the other assets.
The monthly chart provides the context for judging whether a recovery is meaningful or simply another rebound within the decline.
BTCUSD monthly chart
Ethereum: Is Relative Weakness Telling the Story?
Ethereum presents the same benchmark issue: its prior all-time high and its 2026 high belong in separate comparisons.
It also provides an opportunity to examine relative performance within cryptocurrencies. If Ethereum is losing more than Bitcoin on a consistent basis, that highlights where weakness has been greater. It does not, by itself, establish which offers the better buying opportunity.
ETHUSD monthly chart
Gold, Silver, Bitcoin or Ethereum: Which Has Lost the Most?
Silver has suffered the largest drawdown from its 2026 high. Ethereum has done the worst since the end of 2025.
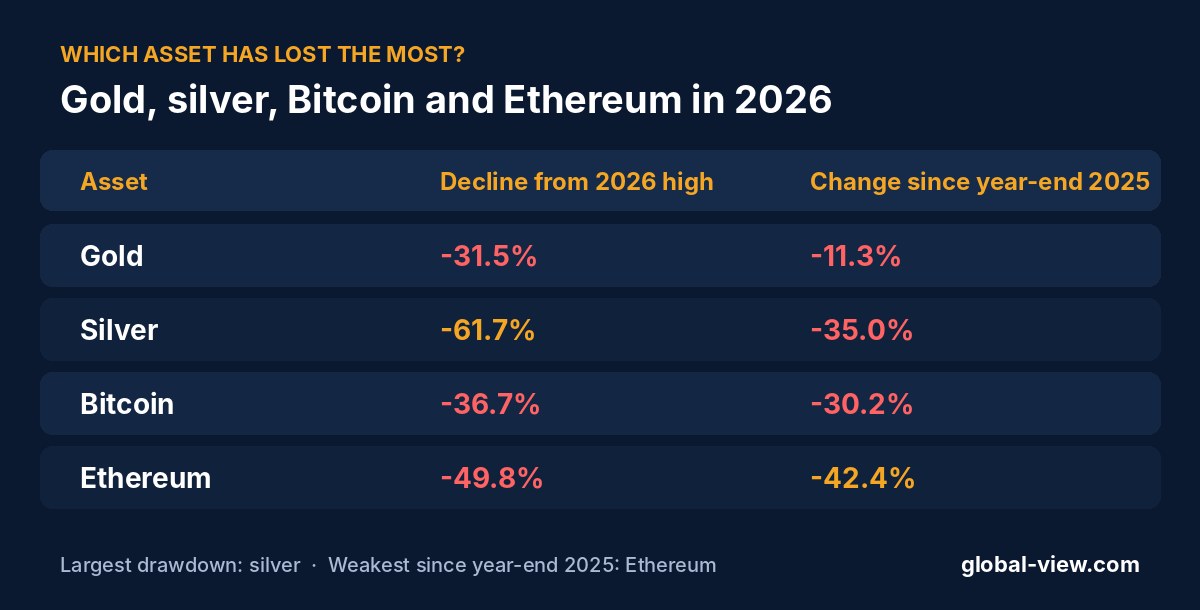
The ranking helps measure the damage. It does not identify the next winner.
The asset that has fallen the most can keep falling. The one that has held up best can still come under pressure.
Similar Timing: A Bottom or Another Pause?
What caught my attention was the apparent clustering of recent lows around the same dates.
If confirmed on consistent price feeds, that timing deserves attention. It could reflect a common period of selling pressure or a broader shift in positioning. It could also prove temporary.
The useful test comes next. Can gold, silver, Bitcoin or Ethereum hold those lows, form higher lows and break resistance?
If recoveries repeatedly fail, the broader trends remain the stronger guide. If buying begins to produce sustained follow-through across several assets, the evidence for stabilization improves.
A large decline creates the temptation to call a bottom.
A change in price behavior gives traders a reason to consider one.
The post Gold, Silver, Bitcoin or Ethereum: Which Is the Biggest Loser in 2026? appeared first on Global View.